29
/
en
AIzaSyAYiBZKx7MnpbEhh9jyipgxe19OcubqV5w
April 1, 2024
206191
Nauru
NRU
true
2
1
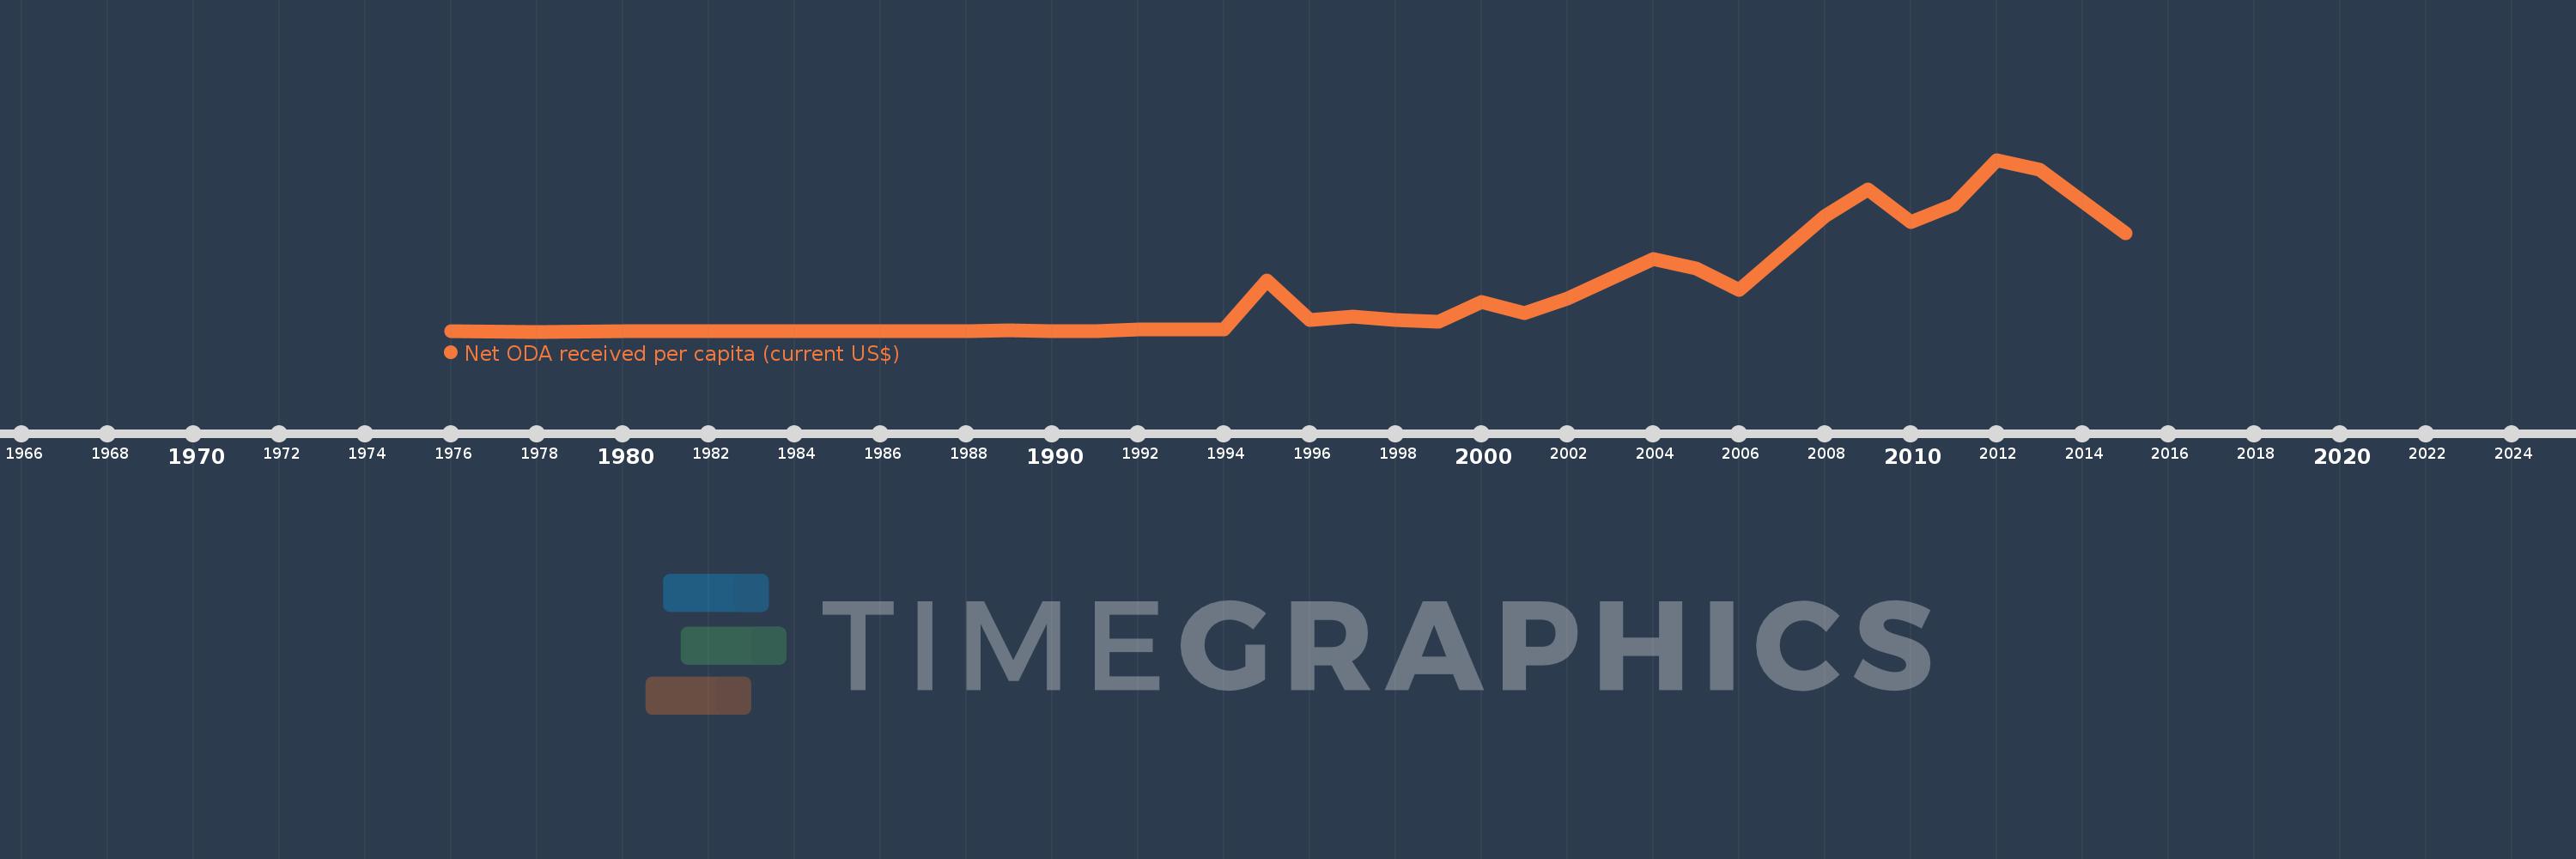
Net ODA received per capita (current US$)
2015,2014,2013,2012,2011,2010,2009,2008,2007,2006,2005,2004,2003,2002,2001,2000,1999,1998,1997,1996,1995,1994,1993,1992,1991,1990,1989,1988,1987,1986,1985,1984,1983,1982,1981,1980,1978,1976
This statistics in other country:
AfghanistanAlbaniaAlgeriaAngolaAntigua and BarbudaArab WorldArgentinaArmeniaArubaAzerbaijanBahamas, TheBahrainBangladeshBarbadosBelarusBelizeBeninBermudaBhutanBoliviaBosnia and HerzegovinaBotswanaBrazilBritish Virgin IslandsBrunei DarussalamBurkina FasoBurundiCabo VerdeCambodiaCameroonCaribbean small statesCayman IslandsCentral African RepublicCentral Europe and the BalticsChadChileChinaColombiaComorosCongo, Dem. Rep.Congo, Rep.Costa RicaCote d'IvoireCroatiaCubaCyprusDjiboutiDominicaDominican RepublicEast Asia & PacificEast Asia & Pacific (excluding high income)East Asia & Pacific (IDA & IBRD countries)EcuadorEgypt, Arab Rep.El SalvadorEquatorial GuineaEritreaEthiopiaEuro areaEurope & Central AsiaEurope & Central Asia (excluding high income)Europe & Central Asia (IDA & IBRD countries)European UnionFijiFragile and conflict affected situationsFrench PolynesiaGabonGambia, TheGeorgiaGhanaGibraltarGrenadaGuatemalaGuineaGuinea-BissauGuyanaHaitiHeavily indebted poor countries (HIPC)High incomeHondurasHong Kong SAR, ChinaIBRD onlyIDA & IBRD totalIDA blendIDA onlyIDA totalIndiaIndonesiaIran, Islamic Rep.IraqIsraelJamaicaJordanKazakhstanKenyaKiribatiKorea, Dem. People’s Rep.Korea, Rep.KosovoKuwaitKyrgyz RepublicLao PDRLatin America & Caribbean Latin America & Caribbean (excluding high income)Latin America & the Caribbean (IDA & IBRD countries)Least developed countries: UN classificationLebanonLesothoLiberiaLibyaLow & middle incomeLow incomeLower middle incomeMacao SAR, ChinaMacedonia, FYRMadagascarMalawiMalaysiaMaldivesMaliMaltaMarshall IslandsMauritaniaMauritiusMexicoMicronesia, Fed. Sts.Middle East & North AfricaMiddle East & North Africa (excluding high income)Middle East & North Africa (IDA & IBRD countries)Middle incomeMoldovaMongoliaMontenegroMoroccoMozambiqueMyanmarNamibiaNauruNepalNew CaledoniaNicaraguaNigerNigeriaNorth AmericaNorthern Mariana IslandsOECD membersOmanOther small statesPacific island small statesPakistanPalauPanamaPapua New GuineaParaguayPeruPhilippinesQatarRwandaSamoaSao Tome and PrincipeSaudi ArabiaSenegalSerbiaSeychellesSierra LeoneSingaporeSloveniaSmall statesSolomon IslandsSomaliaSouth AfricaSouth AsiaSouth Asia (IDA & IBRD)South SudanSri LankaSt. Kitts and NevisSt. LuciaSt. Vincent and the GrenadinesSub-Saharan Africa Sub-Saharan Africa (excluding high income)Sub-Saharan Africa (IDA & IBRD countries)SudanSurinameSwazilandSyrian Arab RepublicTajikistanTanzaniaThailandTimor-LesteTogoTongaTrinidad and TobagoTunisiaTurkeyTurkmenistanTurks and Caicos IslandsTuvaluUgandaUkraineUnited Arab EmiratesUpper middle incomeUruguayUzbekistanVanuatuVenezuela, RBVietnamWest Bank and GazaWorldYemen, Rep.ZambiaZimbabwe Timeline:
This timeline shows a graph from 1976 to 2015 of Nauru. No data until 1975. Number of actual observations by date: 38.
Source name:
World Development Indicators
Source organization:
Development Assistance Committee of the Organisation for Economic Co-operation and Development, Geographical Distribution of Financial Flows to Developing Countries, Development Co-operation Report, and International Development Statistics database. Data are available online at: www.oecd.org/dac/stats/idsonline. World Bank population estimates are used for the denominator.
Categories, topics:
Aid Effectiveness, Economy & Growth, External Debt
Last updated:
apr 23, 2017
Indicators value changes by year
Maximum:
3.763K
jan 1, 2012
At the date of observation
Value
Absolute change
Change from previous value
jan 1, 1976
1.414
+1.414
0.0%
jan 1, 1978
1.382
-0.032
-2.28%
jan 1, 1980
2.705
+1.323
95.73%
jan 1, 1981
4.006
+1.301
48.1%
jan 1, 1982
3.949
-0.057
-1.43%
jan 1, 1983
2.591
-1.358
-34.39%
jan 1, 1984
3.819
+1.228
47.4%
jan 1, 1985
3.747
-0.073
-1.9%
jan 1, 1986
6.117
+2.37
63.26%
jan 1, 1987
4.787
-1.33
-21.74%
jan 1, 1988
7.018
+2.231
46.6%
jan 1, 1989
20.567
+13.549
193.08%
jan 1, 1990
5.583
-14.984
-72.85%
jan 1, 1991
17.473
+11.89
212.98%
jan 1, 1992
40.624
+23.151
132.5%
jan 1, 1993
42.959
+2.335
5.75%
jan 1, 1994
43.214
+0.255
0.59%
jan 1, 1995
1.127K
+1.084K
2.51K%
jan 1, 1996
253.761
-873.685
-77.49%
jan 1, 1997
323.931
+70.17
27.65%
jan 1, 1998
260.541
-63.39
-19.57%
jan 1, 1999
210.861
-49.68
-19.07%
jan 1, 2000
652.131
+441.269
209.27%
jan 1, 2001
398.327
-253.804
-38.92%
jan 1, 2002
722.172
+323.845
81.3%
jan 1, 2003
1.164K
+441.334
61.11%
jan 1, 2004
1.599K
+435.147
37.4%
jan 1, 2005
1.374K
-224.184
-14.02%
jan 1, 2006
915.472
-458.996
-33.39%
jan 1, 2007
1.723K
+807.13
88.17%
jan 1, 2008
2.537K
+814.371
47.28%
jan 1, 2009
3.109K
+572.413
22.56%
jan 1, 2010
2.394K
-715.09
-23.0%
jan 1, 2011
2.771K
+376.776
15.74%
jan 1, 2012
3.763K
+991.748
35.79%
jan 1, 2013
3.545K
-217.825
-5.79%
jan 1, 2014
2.842K
-702.525
-19.82%
jan 1, 2015
2.161K
-681.502
-23.98%
Ranking of countries by current statistics by years


Comments: