29
/
en
AIzaSyAYiBZKx7MnpbEhh9jyipgxe19OcubqV5w
April 1, 2024
264985
Togo
TGO
true
2
1
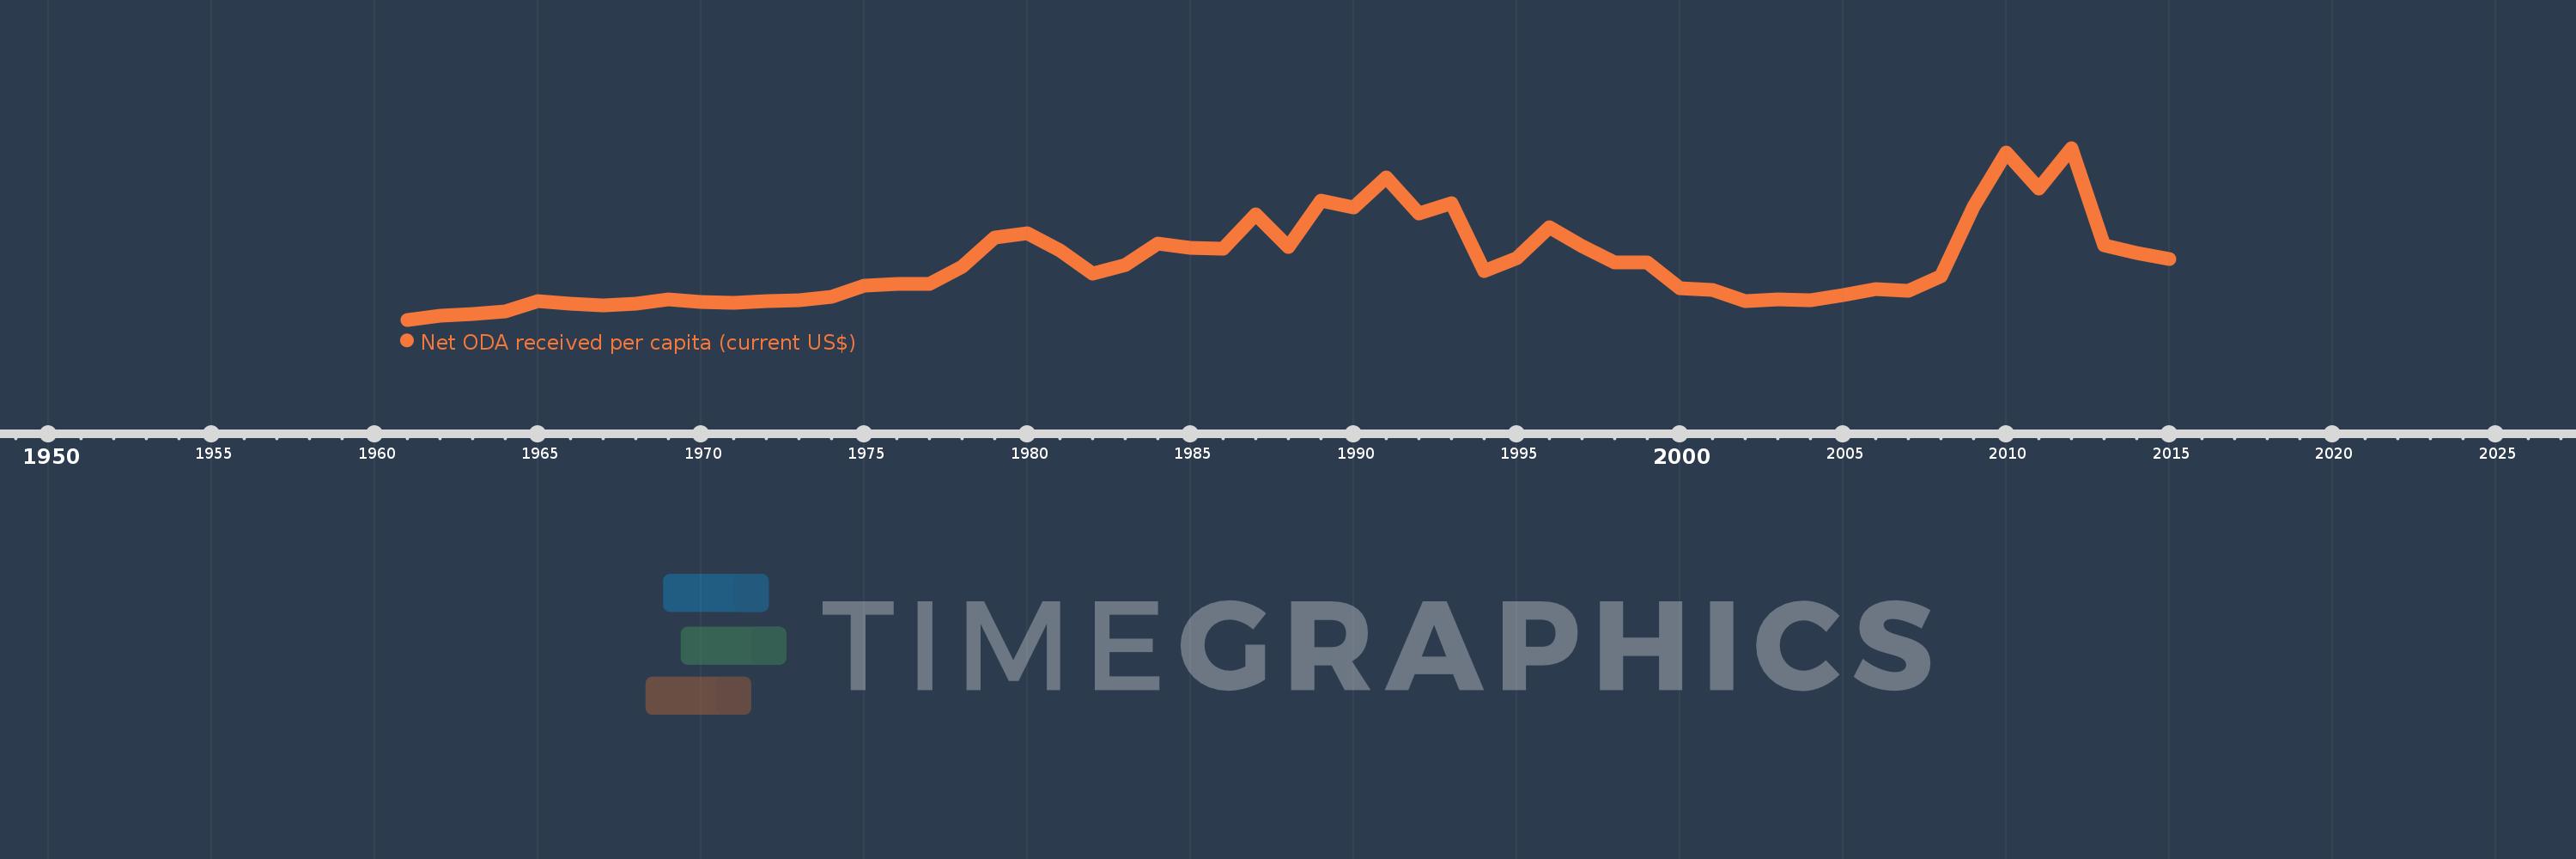
Net ODA received per capita (current US$)
2015,2014,2013,2012,2011,2010,2009,2008,2007,2006,2005,2004,2003,2002,2001,2000,1999,1998,1997,1996,1995,1994,1993,1992,1991,1990,1989,1988,1987,1986,1985,1984,1983,1982,1981,1980,1979,1978,1977,1976,1975,1974,1973,1972,1971,1970,1969,1968,1967,1966,1965,1964,1963,1962,1961
This statistics in other country:
AfghanistanAlbaniaAlgeriaAngolaAntigua and BarbudaArab WorldArgentinaArmeniaArubaAzerbaijanBahamas, TheBahrainBangladeshBarbadosBelarusBelizeBeninBermudaBhutanBoliviaBosnia and HerzegovinaBotswanaBrazilBritish Virgin IslandsBrunei DarussalamBurkina FasoBurundiCabo VerdeCambodiaCameroonCaribbean small statesCayman IslandsCentral African RepublicCentral Europe and the BalticsChadChileChinaColombiaComorosCongo, Dem. Rep.Congo, Rep.Costa RicaCote d'IvoireCroatiaCubaCyprusDjiboutiDominicaDominican RepublicEast Asia & PacificEast Asia & Pacific (excluding high income)East Asia & Pacific (IDA & IBRD countries)EcuadorEgypt, Arab Rep.El SalvadorEquatorial GuineaEritreaEthiopiaEuro areaEurope & Central AsiaEurope & Central Asia (excluding high income)Europe & Central Asia (IDA & IBRD countries)European UnionFijiFragile and conflict affected situationsFrench PolynesiaGabonGambia, TheGeorgiaGhanaGibraltarGrenadaGuatemalaGuineaGuinea-BissauGuyanaHaitiHeavily indebted poor countries (HIPC)High incomeHondurasHong Kong SAR, ChinaIBRD onlyIDA & IBRD totalIDA blendIDA onlyIDA totalIndiaIndonesiaIran, Islamic Rep.IraqIsraelJamaicaJordanKazakhstanKenyaKiribatiKorea, Dem. People’s Rep.Korea, Rep.KosovoKuwaitKyrgyz RepublicLao PDRLatin America & Caribbean Latin America & Caribbean (excluding high income)Latin America & the Caribbean (IDA & IBRD countries)Least developed countries: UN classificationLebanonLesothoLiberiaLibyaLow & middle incomeLow incomeLower middle incomeMacao SAR, ChinaMacedonia, FYRMadagascarMalawiMalaysiaMaldivesMaliMaltaMarshall IslandsMauritaniaMauritiusMexicoMicronesia, Fed. Sts.Middle East & North AfricaMiddle East & North Africa (excluding high income)Middle East & North Africa (IDA & IBRD countries)Middle incomeMoldovaMongoliaMontenegroMoroccoMozambiqueMyanmarNamibiaNauruNepalNew CaledoniaNicaraguaNigerNigeriaNorth AmericaNorthern Mariana IslandsOECD membersOmanOther small statesPacific island small statesPakistanPalauPanamaPapua New GuineaParaguayPeruPhilippinesQatarRwandaSamoaSao Tome and PrincipeSaudi ArabiaSenegalSerbiaSeychellesSierra LeoneSingaporeSloveniaSmall statesSolomon IslandsSomaliaSouth AfricaSouth AsiaSouth Asia (IDA & IBRD)South SudanSri LankaSt. Kitts and NevisSt. LuciaSt. Vincent and the GrenadinesSub-Saharan Africa Sub-Saharan Africa (excluding high income)Sub-Saharan Africa (IDA & IBRD countries)SudanSurinameSwazilandSyrian Arab RepublicTajikistanTanzaniaThailandTimor-LesteTogoTongaTrinidad and TobagoTunisiaTurkeyTurkmenistanTurks and Caicos IslandsTuvaluUgandaUkraineUnited Arab EmiratesUpper middle incomeUruguayUzbekistanVanuatuVenezuela, RBVietnamWest Bank and GazaWorldYemen, Rep.ZambiaZimbabwe Timeline:
This timeline shows a graph from 1961 to 2015 of Togo. No data until 1960. Number of actual observations by date: 55.
Source name:
World Development Indicators
Source organization:
Development Assistance Committee of the Organisation for Economic Co-operation and Development, Geographical Distribution of Financial Flows to Developing Countries, Development Co-operation Report, and International Development Statistics database. Data are available online at: www.oecd.org/dac/stats/idsonline. World Bank population estimates are used for the denominator.
Categories, topics:
Aid Effectiveness, Economy & Growth, External Debt
Last updated:
apr 23, 2017
Indicators value changes by year
Maximum:
82.537
jan 1, 2012
At the date of observation
Value
Absolute change
Change from previous value
jan 1, 1961
0.07
+0.07
0.0%
jan 1, 1962
1.834
+1.764
2.54K%
jan 1, 1963
2.809
+0.975
53.15%
jan 1, 1964
4.075
+1.266
45.09%
jan 1, 1965
8.989
+4.913
120.56%
jan 1, 1966
7.819
-1.17
-13.01%
jan 1, 1967
6.838
-0.982
-12.55%
jan 1, 1968
7.61
+0.772
11.3%
jan 1, 1969
9.724
+2.114
27.77%
jan 1, 1970
8.585
-1.138
-11.71%
jan 1, 1971
8.012
-0.573
-6.67%
jan 1, 1972
8.812
+0.8
9.98%
jan 1, 1973
9.61
+0.798
9.06%
jan 1, 1974
11.21
+1.599
16.64%
jan 1, 1975
16.388
+5.178
46.19%
jan 1, 1976
17.3
+0.912
5.56%
jan 1, 1977
17.367
+0.067
0.39%
jan 1, 1978
25.376
+8.009
46.11%
jan 1, 1979
39.546
+14.171
55.84%
jan 1, 1980
41.421
+1.875
4.74%
jan 1, 1981
33.243
-8.178
-19.74%
jan 1, 1982
22.233
-11.011
-33.12%
jan 1, 1983
26.208
+3.975
17.88%
jan 1, 1984
36.684
+10.476
39.97%
jan 1, 1985
34.474
-2.21
-6.03%
jan 1, 1986
34.086
-0.388
-1.13%
jan 1, 1987
50.644
+16.559
48.58%
jan 1, 1988
34.926
-15.718
-31.04%
jan 1, 1989
57.385
+22.459
64.3%
jan 1, 1990
54.04
-3.345
-5.83%
jan 1, 1991
68.192
+14.152
26.19%
jan 1, 1992
51.268
-16.925
-24.82%
jan 1, 1993
55.826
+4.558
8.89%
jan 1, 1994
23.477
-32.349
-57.95%
jan 1, 1995
29.816
+6.338
27.0%
jan 1, 1996
44.661
+14.845
49.79%
jan 1, 1997
35.375
-9.286
-20.79%
jan 1, 1998
27.742
-7.633
-21.58%
jan 1, 1999
27.752
+0.01
0.04%
jan 1, 2000
15.043
-12.709
-45.8%
jan 1, 2001
14.267
-0.776
-5.16%
jan 1, 2002
9.205
-5.063
-35.49%
jan 1, 2003
9.986
+0.781
8.49%
jan 1, 2004
9.443
-0.543
-5.43%
jan 1, 2005
11.955
+2.512
26.6%
jan 1, 2006
14.797
+2.842
23.77%
jan 1, 2007
13.939
-0.858
-5.8%
jan 1, 2008
20.783
+6.844
49.1%
jan 1, 2009
54.531
+33.748
162.38%
jan 1, 2010
80.151
+25.62
46.98%
jan 1, 2011
63.214
-16.937
-21.13%
jan 1, 2012
82.537
+19.323
30.57%
jan 1, 2013
35.782
-46.755
-56.65%
jan 1, 2014
32.293
-3.489
-9.75%
jan 1, 2015
29.252
-3.042
-9.42%
Ranking of countries by current statistics by years


Comments: