29
/
en
AIzaSyAYiBZKx7MnpbEhh9jyipgxe19OcubqV5w
April 1, 2024
143295
Grenada
GRD
true
2
1
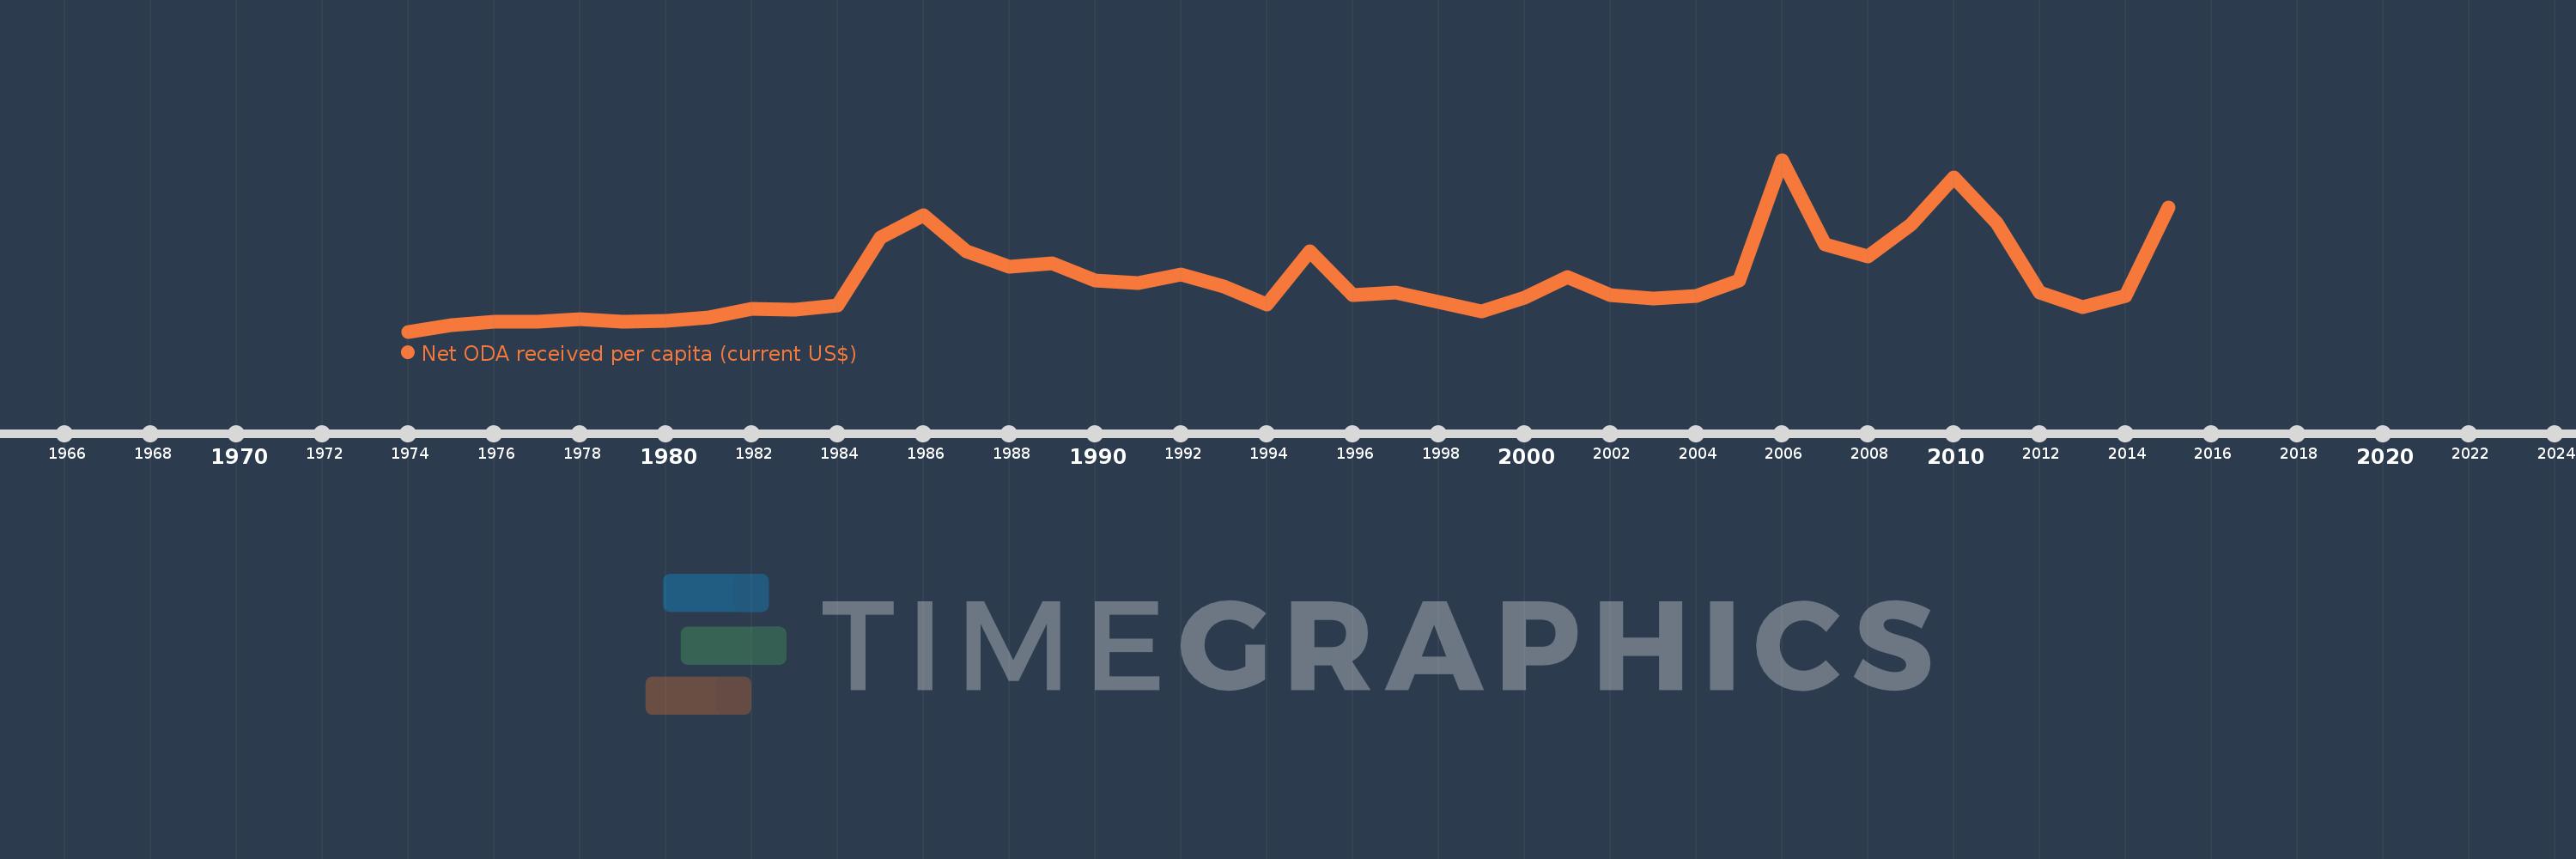
Net ODA received per capita (current US$)
2015,2014,2013,2012,2011,2010,2009,2008,2007,2006,2005,2004,2003,2002,2001,2000,1999,1998,1997,1996,1995,1994,1993,1992,1991,1990,1989,1988,1987,1986,1985,1984,1983,1982,1981,1980,1979,1978,1977,1976,1975,1974
This statistics in other country:
AfghanistanAlbaniaAlgeriaAngolaAntigua and BarbudaArab WorldArgentinaArmeniaArubaAzerbaijanBahamas, TheBahrainBangladeshBarbadosBelarusBelizeBeninBermudaBhutanBoliviaBosnia and HerzegovinaBotswanaBrazilBritish Virgin IslandsBrunei DarussalamBurkina FasoBurundiCabo VerdeCambodiaCameroonCaribbean small statesCayman IslandsCentral African RepublicCentral Europe and the BalticsChadChileChinaColombiaComorosCongo, Dem. Rep.Congo, Rep.Costa RicaCote d'IvoireCroatiaCubaCyprusDjiboutiDominicaDominican RepublicEast Asia & PacificEast Asia & Pacific (excluding high income)East Asia & Pacific (IDA & IBRD countries)EcuadorEgypt, Arab Rep.El SalvadorEquatorial GuineaEritreaEthiopiaEuro areaEurope & Central AsiaEurope & Central Asia (excluding high income)Europe & Central Asia (IDA & IBRD countries)European UnionFijiFragile and conflict affected situationsFrench PolynesiaGabonGambia, TheGeorgiaGhanaGibraltarGrenadaGuatemalaGuineaGuinea-BissauGuyanaHaitiHeavily indebted poor countries (HIPC)High incomeHondurasHong Kong SAR, ChinaIBRD onlyIDA & IBRD totalIDA blendIDA onlyIDA totalIndiaIndonesiaIran, Islamic Rep.IraqIsraelJamaicaJordanKazakhstanKenyaKiribatiKorea, Dem. People’s Rep.Korea, Rep.KosovoKuwaitKyrgyz RepublicLao PDRLatin America & Caribbean Latin America & Caribbean (excluding high income)Latin America & the Caribbean (IDA & IBRD countries)Least developed countries: UN classificationLebanonLesothoLiberiaLibyaLow & middle incomeLow incomeLower middle incomeMacao SAR, ChinaMacedonia, FYRMadagascarMalawiMalaysiaMaldivesMaliMaltaMarshall IslandsMauritaniaMauritiusMexicoMicronesia, Fed. Sts.Middle East & North AfricaMiddle East & North Africa (excluding high income)Middle East & North Africa (IDA & IBRD countries)Middle incomeMoldovaMongoliaMontenegroMoroccoMozambiqueMyanmarNamibiaNauruNepalNew CaledoniaNicaraguaNigerNigeriaNorth AmericaNorthern Mariana IslandsOECD membersOmanOther small statesPacific island small statesPakistanPalauPanamaPapua New GuineaParaguayPeruPhilippinesQatarRwandaSamoaSao Tome and PrincipeSaudi ArabiaSenegalSerbiaSeychellesSierra LeoneSingaporeSloveniaSmall statesSolomon IslandsSomaliaSouth AfricaSouth AsiaSouth Asia (IDA & IBRD)South SudanSri LankaSt. Kitts and NevisSt. LuciaSt. Vincent and the GrenadinesSub-Saharan Africa Sub-Saharan Africa (excluding high income)Sub-Saharan Africa (IDA & IBRD countries)SudanSurinameSwazilandSyrian Arab RepublicTajikistanTanzaniaThailandTimor-LesteTogoTongaTrinidad and TobagoTunisiaTurkeyTurkmenistanTurks and Caicos IslandsTuvaluUgandaUkraineUnited Arab EmiratesUpper middle incomeUruguayUzbekistanVanuatuVenezuela, RBVietnamWest Bank and GazaWorldYemen, Rep.ZambiaZimbabwe Timeline:
This timeline shows a graph from 1974 to 2015 of Grenada. No data until 1973. Number of actual observations by date: 42.
Source name:
World Development Indicators
Source organization:
Development Assistance Committee of the Organisation for Economic Co-operation and Development, Geographical Distribution of Financial Flows to Developing Countries, Development Co-operation Report, and International Development Statistics database. Data are available online at: www.oecd.org/dac/stats/idsonline. World Bank population estimates are used for the denominator.
Categories, topics:
Aid Effectiveness, Economy & Growth, External Debt
Last updated:
apr 23, 2017
Indicators value changes by year
Maximum:
509.951
jan 1, 2006
At the date of observation
Value
Absolute change
Change from previous value
jan 1, 1974
0.534
+0.534
0.0%
jan 1, 1975
19.86
+19.326
3.62K%
jan 1, 1976
29.745
+9.885
49.77%
jan 1, 1977
29.748
+0.003
0.01%
jan 1, 1978
37.034
+7.286
24.49%
jan 1, 1979
29.078
-7.956
-21.48%
jan 1, 1980
32.065
+2.986
10.27%
jan 1, 1981
43.256
+11.192
34.9%
jan 1, 1982
66.906
+23.649
54.67%
jan 1, 1983
66.064
-0.841
-1.26%
jan 1, 1984
77.307
+11.243
17.02%
jan 1, 1985
279.053
+201.746
260.97%
jan 1, 1986
344.42
+65.367
23.42%
jan 1, 1987
239.051
-105.369
-30.59%
jan 1, 1988
192.492
-46.559
-19.48%
jan 1, 1989
204.256
+11.765
6.11%
jan 1, 1990
151.232
-53.024
-25.96%
jan 1, 1991
143.323
-7.909
-5.23%
jan 1, 1992
170.546
+27.223
18.99%
jan 1, 1993
133.023
-37.523
-22.0%
jan 1, 1994
80.059
-52.964
-39.82%
jan 1, 1995
237.518
+157.459
196.68%
jan 1, 1996
107.927
-129.591
-54.56%
jan 1, 1997
117.564
+9.637
8.93%
jan 1, 1998
87.812
-29.752
-25.31%
jan 1, 1999
61.401
-26.412
-30.08%
jan 1, 2000
101.438
+40.038
65.21%
jan 1, 2001
162.37
+60.931
60.07%
jan 1, 2002
107.905
-54.465
-33.54%
jan 1, 2003
99.119
-8.786
-8.14%
jan 1, 2004
105.303
+6.185
6.24%
jan 1, 2005
152.352
+47.049
44.68%
jan 1, 2006
509.951
+357.599
234.72%
jan 1, 2007
258.96
-250.991
-49.22%
jan 1, 2008
222.518
-36.442
-14.07%
jan 1, 2009
318.471
+95.953
43.12%
jan 1, 2010
458.398
+139.927
43.94%
jan 1, 2011
323.28
-135.118
-29.48%
jan 1, 2012
116.399
-206.882
-63.99%
jan 1, 2013
72.528
-43.87
-37.69%
jan 1, 2014
105.38
+32.852
45.3%
jan 1, 2015
369.538
+264.158
250.67%
Ranking of countries by current statistics by years


Comments: