29
/
en
AIzaSyAYiBZKx7MnpbEhh9jyipgxe19OcubqV5w
April 1, 2024
108850
Comoros
COM
true
2
1
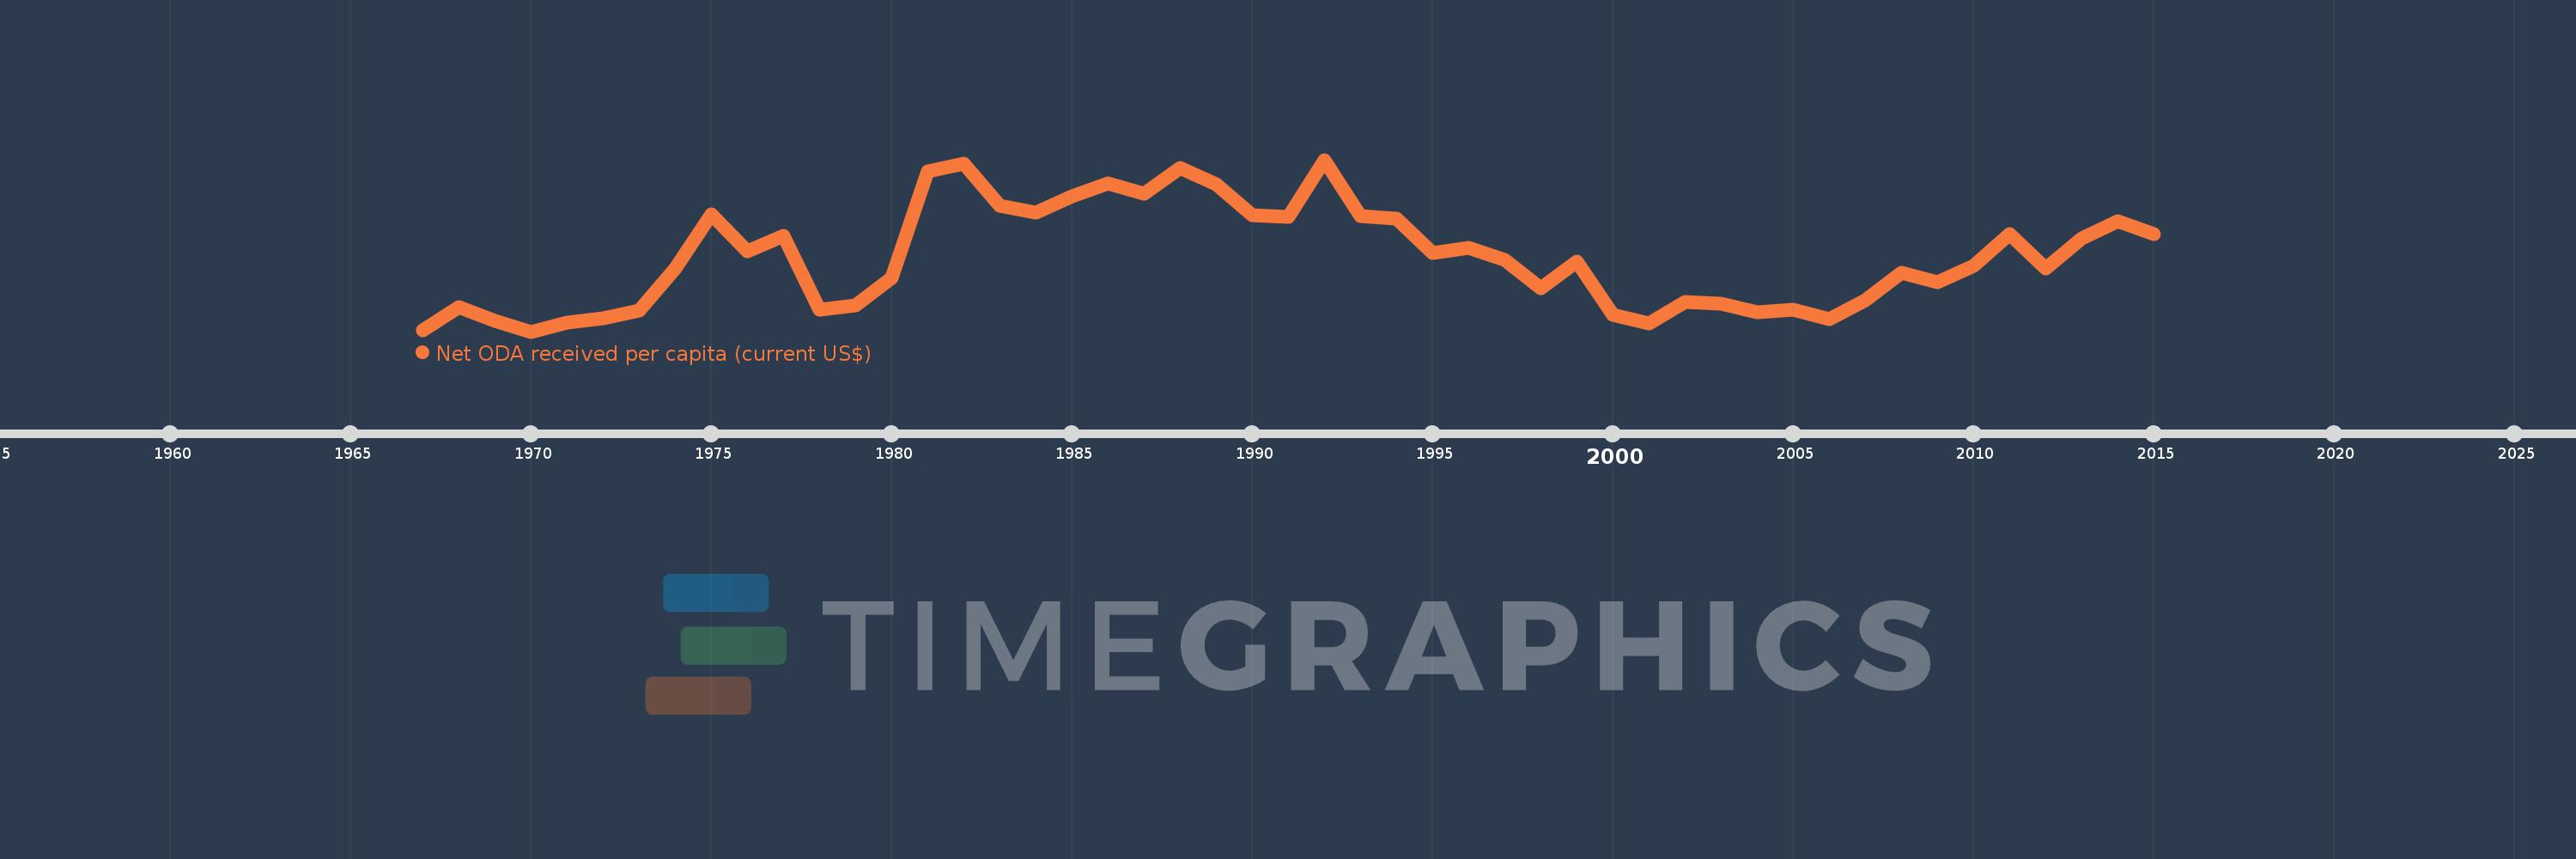
Net ODA received per capita (current US$)
2015,2014,2013,2012,2011,2010,2009,2008,2007,2006,2005,2004,2003,2002,2001,2000,1999,1998,1997,1996,1995,1994,1993,1992,1991,1990,1989,1988,1987,1986,1985,1984,1983,1982,1981,1980,1979,1978,1977,1976,1975,1974,1973,1972,1971,1970,1969,1968,1967
This statistics in other country:
AfghanistanAlbaniaAlgeriaAngolaAntigua and BarbudaArab WorldArgentinaArmeniaArubaAzerbaijanBahamas, TheBahrainBangladeshBarbadosBelarusBelizeBeninBermudaBhutanBoliviaBosnia and HerzegovinaBotswanaBrazilBritish Virgin IslandsBrunei DarussalamBurkina FasoBurundiCabo VerdeCambodiaCameroonCaribbean small statesCayman IslandsCentral African RepublicCentral Europe and the BalticsChadChileChinaColombiaComorosCongo, Dem. Rep.Congo, Rep.Costa RicaCote d'IvoireCroatiaCubaCyprusDjiboutiDominicaDominican RepublicEast Asia & PacificEast Asia & Pacific (excluding high income)East Asia & Pacific (IDA & IBRD countries)EcuadorEgypt, Arab Rep.El SalvadorEquatorial GuineaEritreaEthiopiaEuro areaEurope & Central AsiaEurope & Central Asia (excluding high income)Europe & Central Asia (IDA & IBRD countries)European UnionFijiFragile and conflict affected situationsFrench PolynesiaGabonGambia, TheGeorgiaGhanaGibraltarGrenadaGuatemalaGuineaGuinea-BissauGuyanaHaitiHeavily indebted poor countries (HIPC)High incomeHondurasHong Kong SAR, ChinaIBRD onlyIDA & IBRD totalIDA blendIDA onlyIDA totalIndiaIndonesiaIran, Islamic Rep.IraqIsraelJamaicaJordanKazakhstanKenyaKiribatiKorea, Dem. People’s Rep.Korea, Rep.KosovoKuwaitKyrgyz RepublicLao PDRLatin America & Caribbean Latin America & Caribbean (excluding high income)Latin America & the Caribbean (IDA & IBRD countries)Least developed countries: UN classificationLebanonLesothoLiberiaLibyaLow & middle incomeLow incomeLower middle incomeMacao SAR, ChinaMacedonia, FYRMadagascarMalawiMalaysiaMaldivesMaliMaltaMarshall IslandsMauritaniaMauritiusMexicoMicronesia, Fed. Sts.Middle East & North AfricaMiddle East & North Africa (excluding high income)Middle East & North Africa (IDA & IBRD countries)Middle incomeMoldovaMongoliaMontenegroMoroccoMozambiqueMyanmarNamibiaNauruNepalNew CaledoniaNicaraguaNigerNigeriaNorth AmericaNorthern Mariana IslandsOECD membersOmanOther small statesPacific island small statesPakistanPalauPanamaPapua New GuineaParaguayPeruPhilippinesQatarRwandaSamoaSao Tome and PrincipeSaudi ArabiaSenegalSerbiaSeychellesSierra LeoneSingaporeSloveniaSmall statesSolomon IslandsSomaliaSouth AfricaSouth AsiaSouth Asia (IDA & IBRD)South SudanSri LankaSt. Kitts and NevisSt. LuciaSt. Vincent and the GrenadinesSub-Saharan Africa Sub-Saharan Africa (excluding high income)Sub-Saharan Africa (IDA & IBRD countries)SudanSurinameSwazilandSyrian Arab RepublicTajikistanTanzaniaThailandTimor-LesteTogoTongaTrinidad and TobagoTunisiaTurkeyTurkmenistanTurks and Caicos IslandsTuvaluUgandaUkraineUnited Arab EmiratesUpper middle incomeUruguayUzbekistanVanuatuVenezuela, RBVietnamWest Bank and GazaWorldYemen, Rep.ZambiaZimbabwe Timeline:
This timeline shows a graph from 1967 to 2015 of Comoros. No data until 1966. Number of actual observations by date: 49.
Source name:
World Development Indicators
Source organization:
Development Assistance Committee of the Organisation for Economic Co-operation and Development, Geographical Distribution of Financial Flows to Developing Countries, Development Co-operation Report, and International Development Statistics database. Data are available online at: www.oecd.org/dac/stats/idsonline. World Bank population estimates are used for the denominator.
Categories, topics:
Aid Effectiveness, Economy & Growth, External Debt
Last updated:
apr 23, 2017
Indicators value changes by year
Maximum:
148.051
jan 1, 1992
At the date of observation
Value
Absolute change
Change from previous value
jan 1, 1967
29.112
+29.112
0.0%
jan 1, 1968
45.319
+16.207
55.67%
jan 1, 1969
35.878
-9.441
-20.83%
jan 1, 1970
28.44
-7.439
-20.73%
jan 1, 1971
34.538
+6.098
21.44%
jan 1, 1972
37.834
+3.296
9.54%
jan 1, 1973
42.936
+5.102
13.49%
jan 1, 1974
72.548
+29.612
68.97%
jan 1, 1975
109.834
+37.286
51.4%
jan 1, 1976
84.117
-25.717
-23.41%
jan 1, 1977
95.237
+11.119
13.22%
jan 1, 1978
43.884
-51.352
-53.92%
jan 1, 1979
46.897
+3.013
6.87%
jan 1, 1980
65.757
+18.859
40.21%
jan 1, 1981
140.186
+74.43
113.19%
jan 1, 1982
145.516
+5.33
3.8%
jan 1, 1983
115.942
-29.574
-20.32%
jan 1, 1984
111.38
-4.562
-3.93%
jan 1, 1985
122.803
+11.423
10.26%
jan 1, 1986
131.748
+8.945
7.28%
jan 1, 1987
124.66
-7.088
-5.38%
jan 1, 1988
142.444
+17.784
14.27%
jan 1, 1989
130.953
-11.491
-8.07%
jan 1, 1990
109.354
-21.599
-16.49%
jan 1, 1991
108.107
-1.247
-1.14%
jan 1, 1992
148.051
+39.944
36.95%
jan 1, 1993
108.733
-39.318
-26.56%
jan 1, 1994
107.284
-1.449
-1.33%
jan 1, 1995
82.992
-24.292
-22.64%
jan 1, 1996
86.744
+3.751
4.52%
jan 1, 1997
78.523
-8.221
-9.48%
jan 1, 1998
58.576
-19.947
-25.4%
jan 1, 1999
77.069
+18.494
31.57%
jan 1, 2000
40.175
-36.894
-47.87%
jan 1, 2001
34.161
-6.014
-14.97%
jan 1, 2002
49.081
+14.919
43.67%
jan 1, 2003
47.93
-1.151
-2.35%
jan 1, 2004
41.628
-6.301
-13.15%
jan 1, 2005
43.586
+1.957
4.7%
jan 1, 2006
36.888
-6.698
-15.37%
jan 1, 2007
50.299
+13.411
36.36%
jan 1, 2008
69.264
+18.965
37.7%
jan 1, 2009
62.578
-6.686
-9.65%
jan 1, 2010
73.99
+11.413
18.24%
jan 1, 2011
96.208
+22.218
30.03%
jan 1, 2012
72.517
-23.691
-24.62%
jan 1, 2013
93.599
+21.082
29.07%
jan 1, 2014
105.109
+11.51
12.3%
jan 1, 2015
96.066
-9.043
-8.6%
Ranking of countries by current statistics by years


Comments: