29
/
en
AIzaSyAYiBZKx7MnpbEhh9jyipgxe19OcubqV5w
April 1, 2024
258694
Syrian Arab Republic
SYR
true
2
1
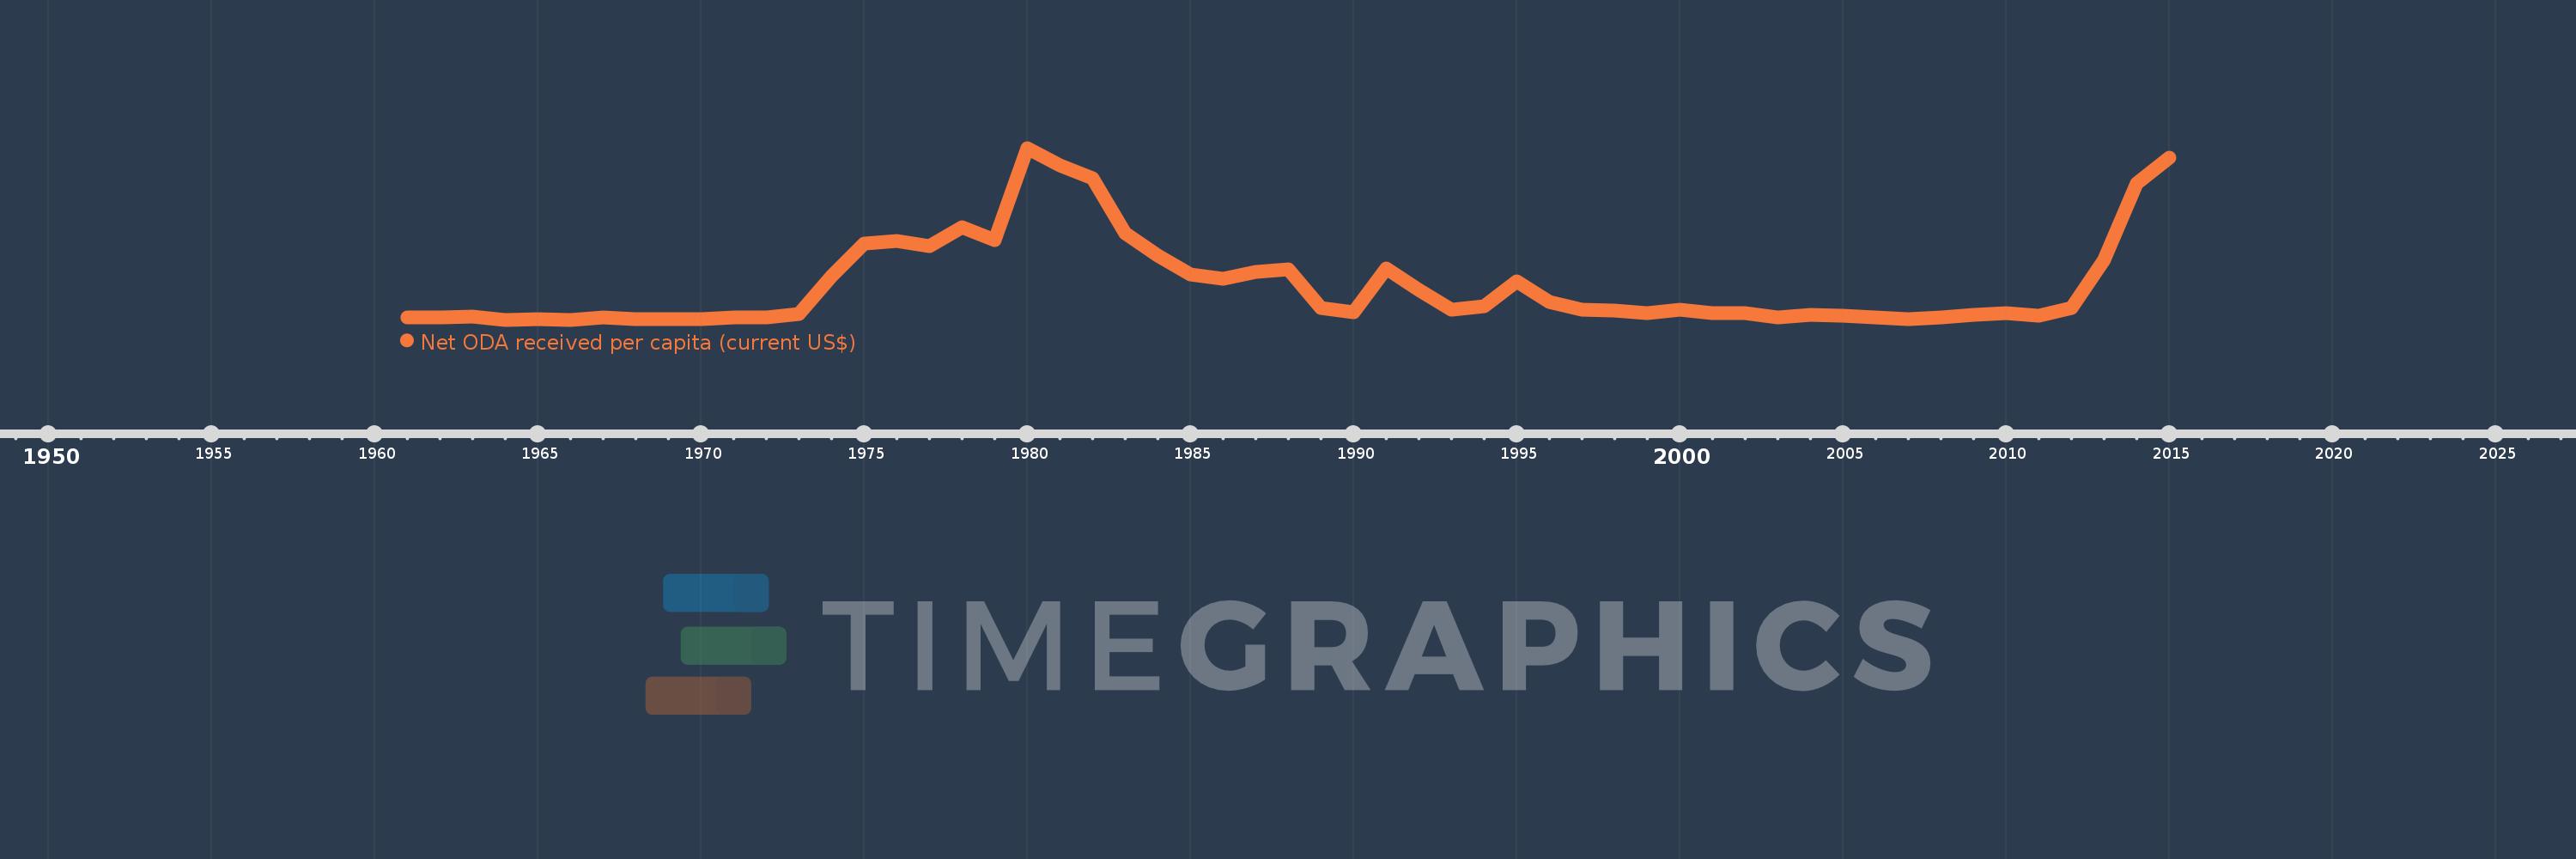
Net ODA received per capita (current US$)
2015,2014,2013,2012,2011,2010,2009,2008,2007,2006,2005,2004,2003,2002,2001,2000,1999,1998,1997,1996,1995,1994,1993,1992,1991,1990,1989,1988,1987,1986,1985,1984,1983,1982,1981,1980,1979,1978,1977,1976,1975,1974,1973,1972,1971,1970,1969,1968,1967,1966,1965,1964,1963,1962,1961
This statistics in other country:
AfghanistanAlbaniaAlgeriaAngolaAntigua and BarbudaArab WorldArgentinaArmeniaArubaAzerbaijanBahamas, TheBahrainBangladeshBarbadosBelarusBelizeBeninBermudaBhutanBoliviaBosnia and HerzegovinaBotswanaBrazilBritish Virgin IslandsBrunei DarussalamBurkina FasoBurundiCabo VerdeCambodiaCameroonCaribbean small statesCayman IslandsCentral African RepublicCentral Europe and the BalticsChadChileChinaColombiaComorosCongo, Dem. Rep.Congo, Rep.Costa RicaCote d'IvoireCroatiaCubaCyprusDjiboutiDominicaDominican RepublicEast Asia & PacificEast Asia & Pacific (excluding high income)East Asia & Pacific (IDA & IBRD countries)EcuadorEgypt, Arab Rep.El SalvadorEquatorial GuineaEritreaEthiopiaEuro areaEurope & Central AsiaEurope & Central Asia (excluding high income)Europe & Central Asia (IDA & IBRD countries)European UnionFijiFragile and conflict affected situationsFrench PolynesiaGabonGambia, TheGeorgiaGhanaGibraltarGrenadaGuatemalaGuineaGuinea-BissauGuyanaHaitiHeavily indebted poor countries (HIPC)High incomeHondurasHong Kong SAR, ChinaIBRD onlyIDA & IBRD totalIDA blendIDA onlyIDA totalIndiaIndonesiaIran, Islamic Rep.IraqIsraelJamaicaJordanKazakhstanKenyaKiribatiKorea, Dem. People’s Rep.Korea, Rep.KosovoKuwaitKyrgyz RepublicLao PDRLatin America & Caribbean Latin America & Caribbean (excluding high income)Latin America & the Caribbean (IDA & IBRD countries)Least developed countries: UN classificationLebanonLesothoLiberiaLibyaLow & middle incomeLow incomeLower middle incomeMacao SAR, ChinaMacedonia, FYRMadagascarMalawiMalaysiaMaldivesMaliMaltaMarshall IslandsMauritaniaMauritiusMexicoMicronesia, Fed. Sts.Middle East & North AfricaMiddle East & North Africa (excluding high income)Middle East & North Africa (IDA & IBRD countries)Middle incomeMoldovaMongoliaMontenegroMoroccoMozambiqueMyanmarNamibiaNauruNepalNew CaledoniaNicaraguaNigerNigeriaNorth AmericaNorthern Mariana IslandsOECD membersOmanOther small statesPacific island small statesPakistanPalauPanamaPapua New GuineaParaguayPeruPhilippinesQatarRwandaSamoaSao Tome and PrincipeSaudi ArabiaSenegalSerbiaSeychellesSierra LeoneSingaporeSloveniaSmall statesSolomon IslandsSomaliaSouth AfricaSouth AsiaSouth Asia (IDA & IBRD)South SudanSri LankaSt. Kitts and NevisSt. LuciaSt. Vincent and the GrenadinesSub-Saharan Africa Sub-Saharan Africa (excluding high income)Sub-Saharan Africa (IDA & IBRD countries)SudanSurinameSwazilandSyrian Arab RepublicTajikistanTanzaniaThailandTimor-LesteTogoTongaTrinidad and TobagoTunisiaTurkeyTurkmenistanTurks and Caicos IslandsTuvaluUgandaUkraineUnited Arab EmiratesUpper middle incomeUruguayUzbekistanVanuatuVenezuela, RBVietnamWest Bank and GazaWorldYemen, Rep.ZambiaZimbabwe Timeline:
This timeline shows a graph from 1961 to 2015 of Syrian Arab Republic. No data until 1960. Number of actual observations by date: 55.
Source name:
World Development Indicators
Source organization:
Development Assistance Committee of the Organisation for Economic Co-operation and Development, Geographical Distribution of Financial Flows to Developing Countries, Development Co-operation Report, and International Development Statistics database. Data are available online at: www.oecd.org/dac/stats/idsonline. World Bank population estimates are used for the denominator.
Categories, topics:
Aid Effectiveness, Economy & Growth, External Debt
Last updated:
apr 23, 2017
Indicators value changes by year
Maximum:
237.506
jan 1, 1980
At the date of observation
Value
Absolute change
Change from previous value
jan 1, 1961
4.004
+4.004
0.0%
jan 1, 1962
3.416
-0.588
-14.69%
jan 1, 1963
5.101
+1.685
49.32%
jan 1, 1964
0.536
-4.565
-89.5%
jan 1, 1965
0.9
+0.364
67.9%
jan 1, 1966
0.606
-0.294
-32.66%
jan 1, 1967
3.637
+3.031
500.37%
jan 1, 1968
1.007
-2.629
-72.3%
jan 1, 1969
0.875
-0.132
-13.1%
jan 1, 1970
1.782
+0.907
103.58%
jan 1, 1971
3.424
+1.642
92.13%
jan 1, 1972
3.285
-0.139
-4.05%
jan 1, 1973
7.988
+4.703
143.16%
jan 1, 1974
60.254
+52.265
654.28%
jan 1, 1975
105.516
+45.263
75.12%
jan 1, 1976
109.397
+3.881
3.68%
jan 1, 1977
101.695
-7.702
-7.04%
jan 1, 1978
127.757
+26.062
25.63%
jan 1, 1979
109.992
-17.765
-13.91%
jan 1, 1980
237.506
+127.514
115.93%
jan 1, 1981
213.578
-23.928
-10.07%
jan 1, 1982
195.171
-18.408
-8.62%
jan 1, 1983
120.238
-74.933
-38.39%
jan 1, 1984
89.447
-30.791
-25.61%
jan 1, 1985
62.441
-27.007
-30.19%
jan 1, 1986
57.183
-5.258
-8.42%
jan 1, 1987
65.975
+8.792
15.38%
jan 1, 1988
69.64
+3.665
5.56%
jan 1, 1989
16.2
-53.44
-76.74%
jan 1, 1990
10.309
-5.891
-36.37%
jan 1, 1991
70.9
+60.592
587.77%
jan 1, 1992
41.778
-29.123
-41.08%
jan 1, 1993
14.92
-26.858
-64.29%
jan 1, 1994
19.07
+4.15
27.81%
jan 1, 1995
53.369
+34.299
179.86%
jan 1, 1996
24.837
-28.532
-53.46%
jan 1, 1997
14.657
-10.18
-40.99%
jan 1, 1998
12.981
-1.676
-11.43%
jan 1, 1999
9.965
-3.016
-23.24%
jan 1, 2000
14.305
+4.34
43.56%
jan 1, 2001
9.719
-4.587
-32.06%
jan 1, 2002
9.161
-0.558
-5.74%
jan 1, 2003
3.693
-5.468
-59.68%
jan 1, 2004
7.058
+3.365
91.1%
jan 1, 2005
5.977
-1.081
-15.32%
jan 1, 2006
3.873
-2.105
-35.21%
jan 1, 2007
1.025
-2.848
-73.54%
jan 1, 2008
4.301
+3.276
319.7%
jan 1, 2009
7.8
+3.5
81.38%
jan 1, 2010
10.117
+2.317
29.7%
jan 1, 2011
6.511
-3.605
-35.64%
jan 1, 2012
16.382
+9.87
151.58%
jan 1, 2013
83.667
+67.286
410.74%
jan 1, 2014
188.266
+104.598
125.02%
jan 1, 2015
223.626
+35.36
18.78%
Ranking of countries by current statistics by years


Comments: