29
/
en
AIzaSyAYiBZKx7MnpbEhh9jyipgxe19OcubqV5w
April 1, 2024
207146
Nepal
NPL
true
2
1
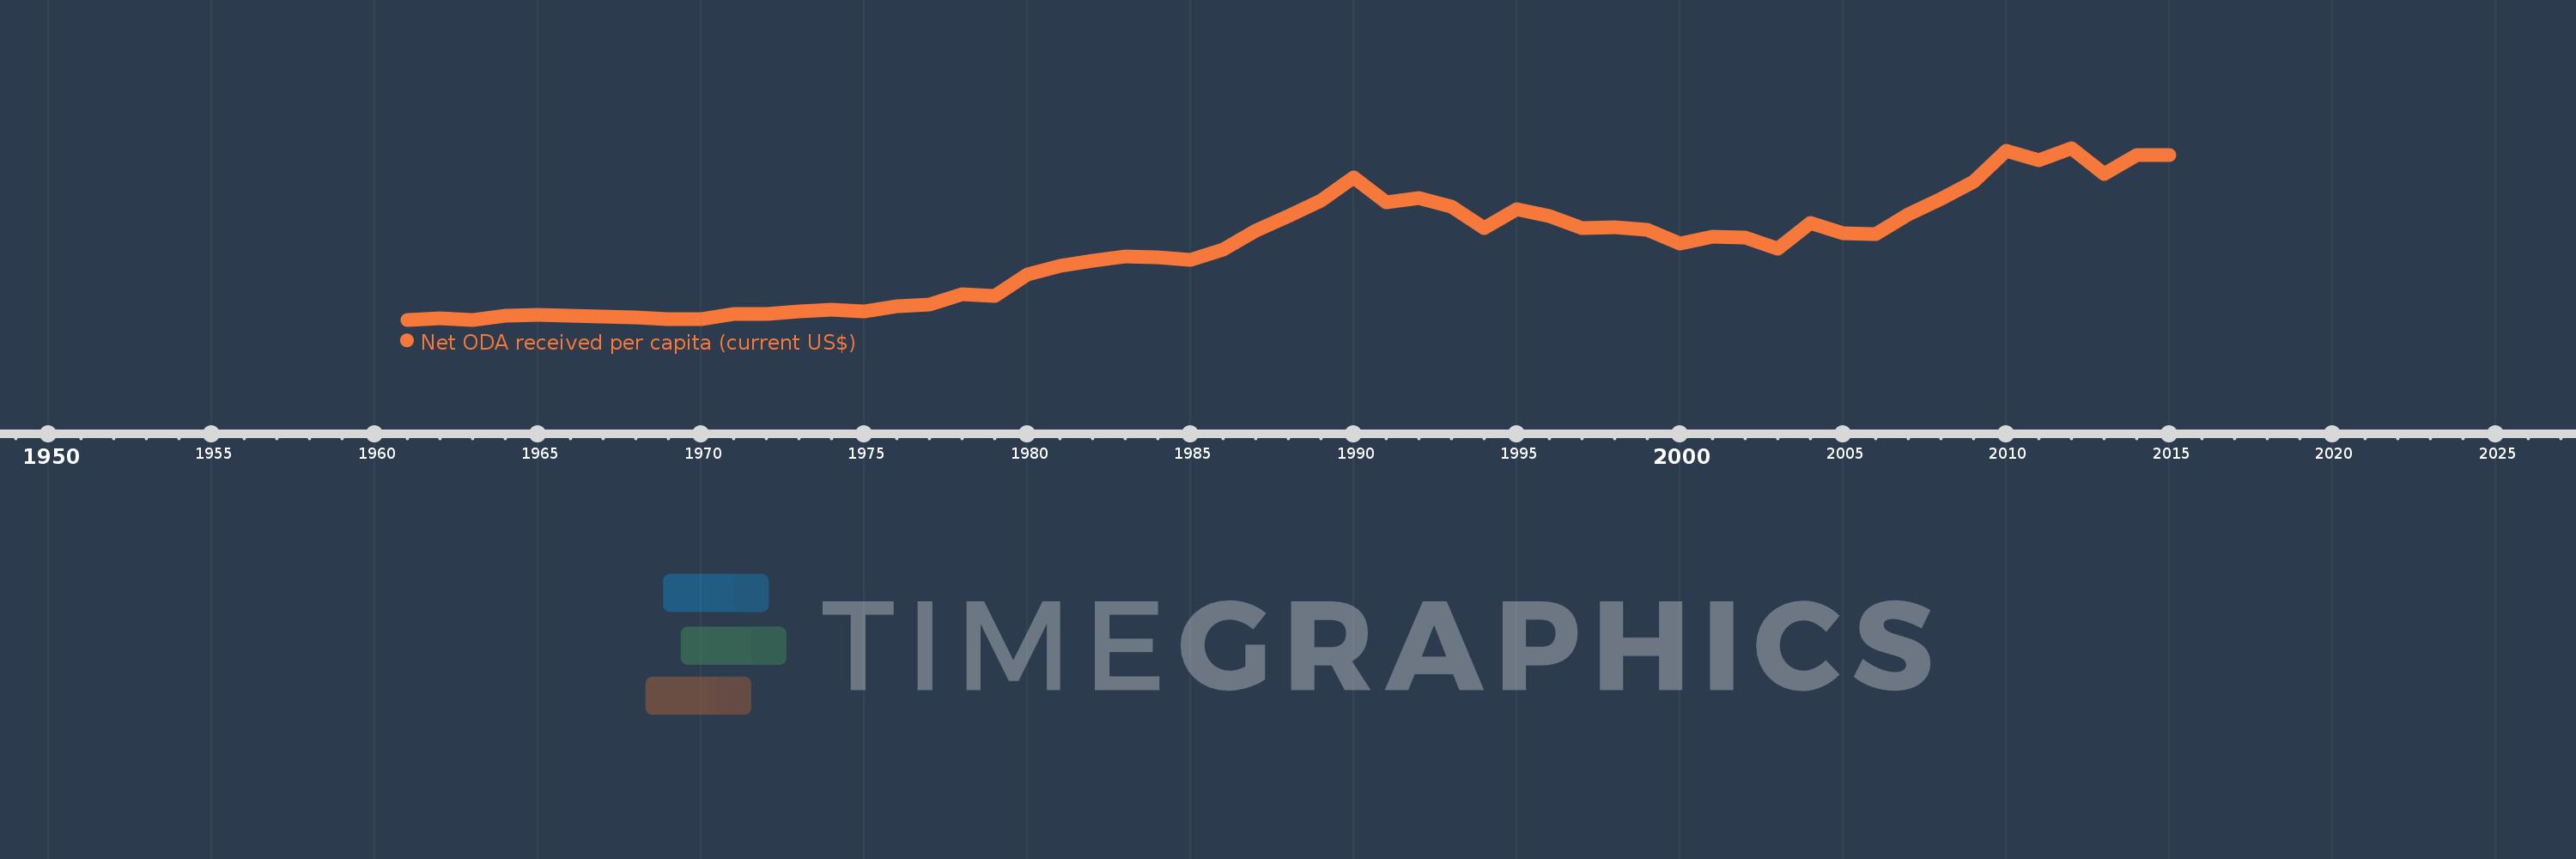
Net ODA received per capita (current US$)
2015,2014,2013,2012,2011,2010,2009,2008,2007,2006,2005,2004,2003,2002,2001,2000,1999,1998,1997,1996,1995,1994,1993,1992,1991,1990,1989,1988,1987,1986,1985,1984,1983,1982,1981,1980,1979,1978,1977,1976,1975,1974,1973,1972,1971,1970,1969,1968,1967,1966,1965,1964,1963,1962,1961
This statistics in other country:
AfghanistanAlbaniaAlgeriaAngolaAntigua and BarbudaArab WorldArgentinaArmeniaArubaAzerbaijanBahamas, TheBahrainBangladeshBarbadosBelarusBelizeBeninBermudaBhutanBoliviaBosnia and HerzegovinaBotswanaBrazilBritish Virgin IslandsBrunei DarussalamBurkina FasoBurundiCabo VerdeCambodiaCameroonCaribbean small statesCayman IslandsCentral African RepublicCentral Europe and the BalticsChadChileChinaColombiaComorosCongo, Dem. Rep.Congo, Rep.Costa RicaCote d'IvoireCroatiaCubaCyprusDjiboutiDominicaDominican RepublicEast Asia & PacificEast Asia & Pacific (excluding high income)East Asia & Pacific (IDA & IBRD countries)EcuadorEgypt, Arab Rep.El SalvadorEquatorial GuineaEritreaEthiopiaEuro areaEurope & Central AsiaEurope & Central Asia (excluding high income)Europe & Central Asia (IDA & IBRD countries)European UnionFijiFragile and conflict affected situationsFrench PolynesiaGabonGambia, TheGeorgiaGhanaGibraltarGrenadaGuatemalaGuineaGuinea-BissauGuyanaHaitiHeavily indebted poor countries (HIPC)High incomeHondurasHong Kong SAR, ChinaIBRD onlyIDA & IBRD totalIDA blendIDA onlyIDA totalIndiaIndonesiaIran, Islamic Rep.IraqIsraelJamaicaJordanKazakhstanKenyaKiribatiKorea, Dem. People’s Rep.Korea, Rep.KosovoKuwaitKyrgyz RepublicLao PDRLatin America & Caribbean Latin America & Caribbean (excluding high income)Latin America & the Caribbean (IDA & IBRD countries)Least developed countries: UN classificationLebanonLesothoLiberiaLibyaLow & middle incomeLow incomeLower middle incomeMacao SAR, ChinaMacedonia, FYRMadagascarMalawiMalaysiaMaldivesMaliMaltaMarshall IslandsMauritaniaMauritiusMexicoMicronesia, Fed. Sts.Middle East & North AfricaMiddle East & North Africa (excluding high income)Middle East & North Africa (IDA & IBRD countries)Middle incomeMoldovaMongoliaMontenegroMoroccoMozambiqueMyanmarNamibiaNauruNepalNew CaledoniaNicaraguaNigerNigeriaNorth AmericaNorthern Mariana IslandsOECD membersOmanOther small statesPacific island small statesPakistanPalauPanamaPapua New GuineaParaguayPeruPhilippinesQatarRwandaSamoaSao Tome and PrincipeSaudi ArabiaSenegalSerbiaSeychellesSierra LeoneSingaporeSloveniaSmall statesSolomon IslandsSomaliaSouth AfricaSouth AsiaSouth Asia (IDA & IBRD)South SudanSri LankaSt. Kitts and NevisSt. LuciaSt. Vincent and the GrenadinesSub-Saharan Africa Sub-Saharan Africa (excluding high income)Sub-Saharan Africa (IDA & IBRD countries)SudanSurinameSwazilandSyrian Arab RepublicTajikistanTanzaniaThailandTimor-LesteTogoTongaTrinidad and TobagoTunisiaTurkeyTurkmenistanTurks and Caicos IslandsTuvaluUgandaUkraineUnited Arab EmiratesUpper middle incomeUruguayUzbekistanVanuatuVenezuela, RBVietnamWest Bank and GazaWorldYemen, Rep.ZambiaZimbabwe Timeline:
This timeline shows a graph from 1961 to 2015 of Nepal. No data until 1960. Number of actual observations by date: 55.
Source name:
World Development Indicators
Source organization:
Development Assistance Committee of the Organisation for Economic Co-operation and Development, Geographical Distribution of Financial Flows to Developing Countries, Development Co-operation Report, and International Development Statistics database. Data are available online at: www.oecd.org/dac/stats/idsonline. World Bank population estimates are used for the denominator.
Categories, topics:
Aid Effectiveness, Economy & Growth, External Debt
Last updated:
apr 23, 2017
Indicators value changes by year
Maximum:
32.634
jan 1, 2012
At the date of observation
Value
Absolute change
Change from previous value
jan 1, 1961
0.857
+0.857
0.0%
jan 1, 1962
1.05
+0.193
22.55%
jan 1, 1963
0.871
-0.179
-17.06%
jan 1, 1964
1.538
+0.667
76.57%
jan 1, 1965
1.818
+0.28
18.19%
jan 1, 1966
1.64
-0.178
-9.82%
jan 1, 1967
1.367
-0.272
-16.6%
jan 1, 1968
1.236
-0.132
-9.65%
jan 1, 1969
0.946
-0.29
-23.44%
jan 1, 1970
0.922
-0.023
-2.47%
jan 1, 1971
1.955
+1.032
111.89%
jan 1, 1972
1.949
-0.006
-0.29%
jan 1, 1973
2.413
+0.464
23.8%
jan 1, 1974
2.76
+0.347
14.4%
jan 1, 1975
2.458
-0.302
-10.96%
jan 1, 1976
3.279
+0.822
33.43%
jan 1, 1977
3.647
+0.368
11.21%
jan 1, 1978
5.569
+1.922
52.69%
jan 1, 1979
5.326
-0.242
-4.35%
jan 1, 1980
9.19
+3.864
72.54%
jan 1, 1981
10.745
+1.554
16.91%
jan 1, 1982
11.696
+0.952
8.86%
jan 1, 1983
12.618
+0.922
7.88%
jan 1, 1984
12.395
-0.223
-1.77%
jan 1, 1985
11.871
-0.524
-4.23%
jan 1, 1986
13.798
+1.927
16.24%
jan 1, 1987
17.26
+3.462
25.09%
jan 1, 1988
20.048
+2.788
16.15%
jan 1, 1989
22.858
+2.809
14.01%
jan 1, 1990
27.228
+4.37
19.12%
jan 1, 1991
22.561
-4.667
-17.14%
jan 1, 1992
23.328
+0.766
3.4%
jan 1, 1993
21.761
-1.567
-6.72%
jan 1, 1994
17.853
-3.907
-17.96%
jan 1, 1995
21.375
+3.521
19.72%
jan 1, 1996
20.046
-1.329
-6.22%
jan 1, 1997
17.736
-2.31
-11.52%
jan 1, 1998
17.944
+0.208
1.17%
jan 1, 1999
17.526
-0.418
-2.33%
jan 1, 2000
14.943
-2.583
-14.74%
jan 1, 2001
16.262
+1.32
8.83%
jan 1, 2002
16.141
-0.121
-0.75%
jan 1, 2003
13.971
-2.17
-13.45%
jan 1, 2004
18.762
+4.791
34.29%
jan 1, 2005
16.87
-1.892
-10.08%
jan 1, 2006
16.628
-0.242
-1.43%
jan 1, 2007
20.413
+3.785
22.76%
jan 1, 2008
23.147
+2.733
13.39%
jan 1, 2009
26.46
+3.313
14.31%
jan 1, 2010
32.126
+5.666
21.41%
jan 1, 2011
30.427
-1.699
-5.29%
jan 1, 2012
32.634
+2.207
7.25%
jan 1, 2013
27.898
-4.736
-14.51%
jan 1, 2014
31.274
+3.376
12.1%
jan 1, 2015
31.236
-0.037
-0.12%
Ranking of countries by current statistics by years


Comments: