29
/
en
AIzaSyAYiBZKx7MnpbEhh9jyipgxe19OcubqV5w
April 1, 2024
32902
Europe & Central Asia (IDA & IBRD countries)
TEC
false
2
1
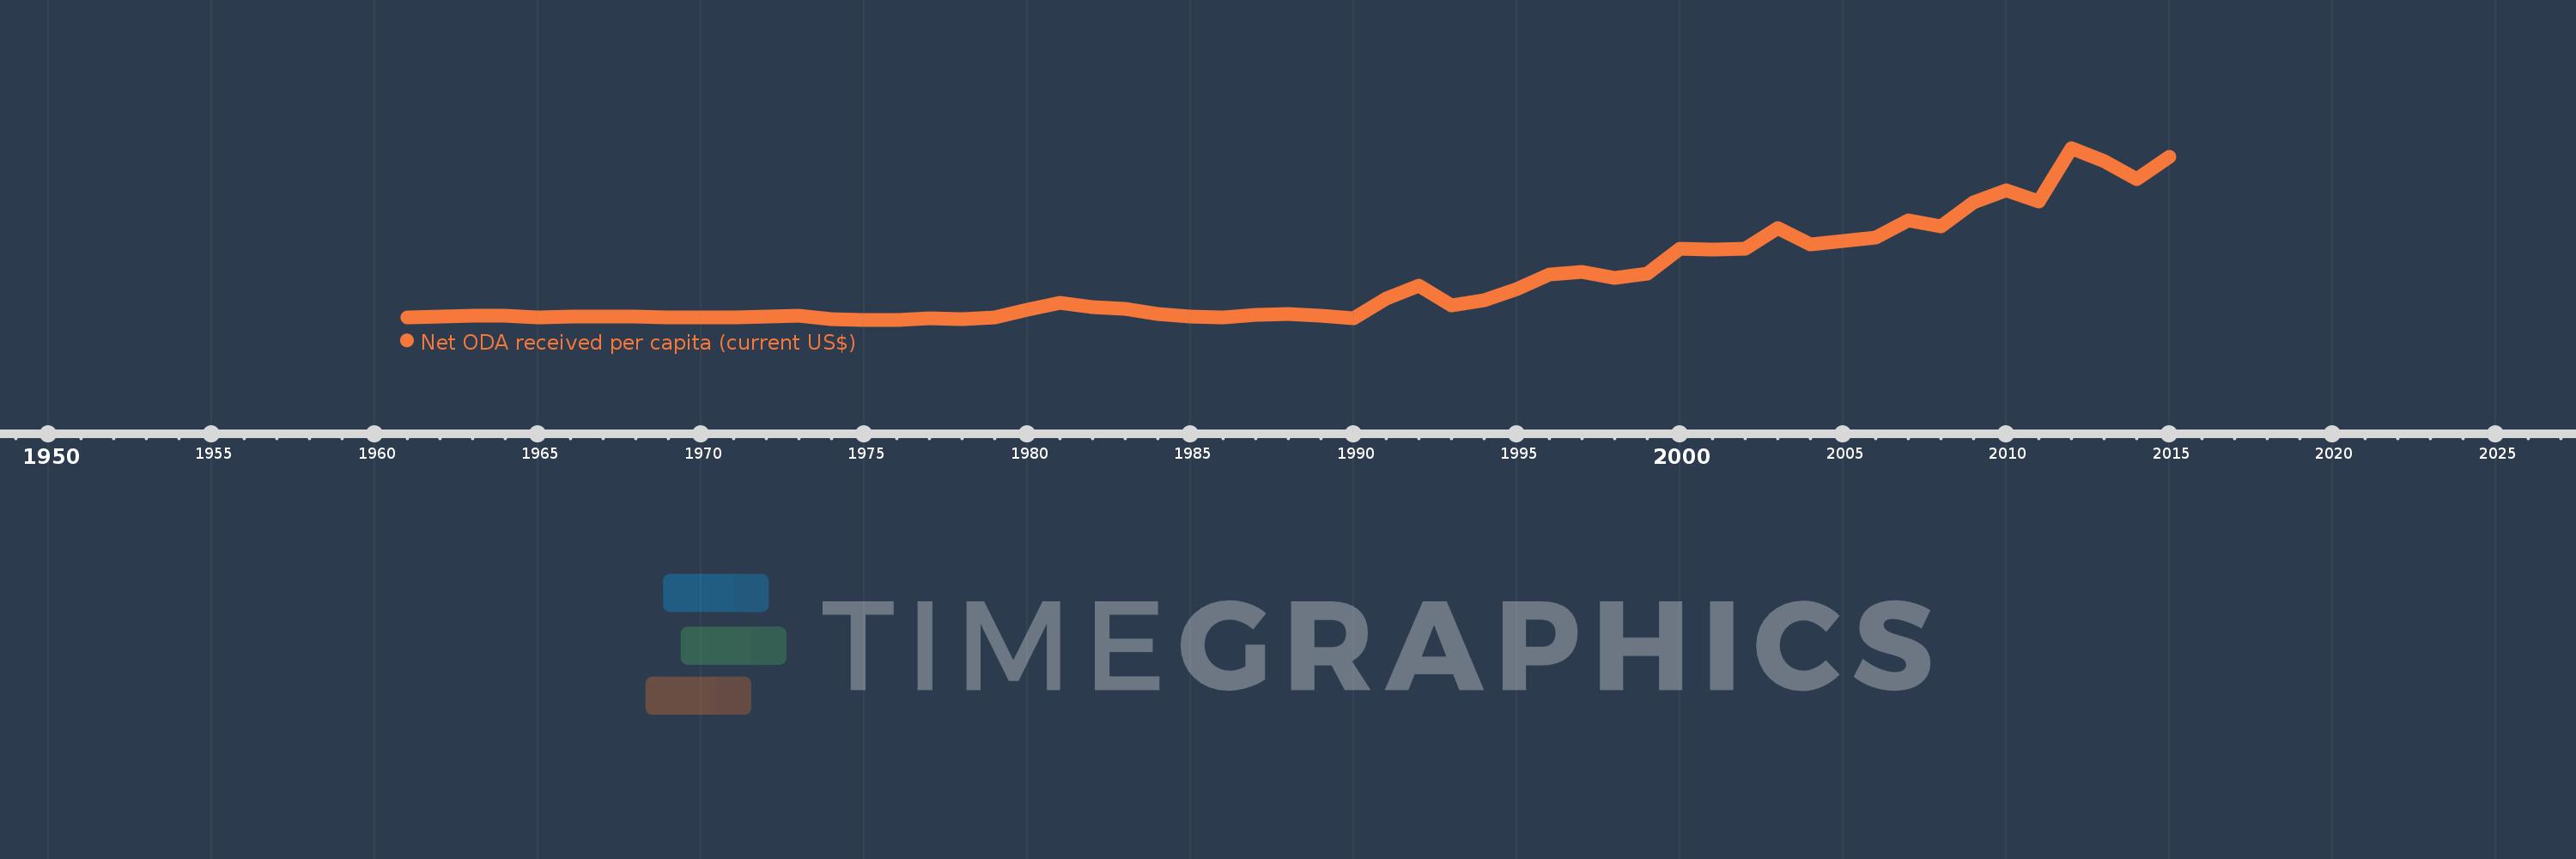
Net ODA received per capita (current US$)
2015,2014,2013,2012,2011,2010,2009,2008,2007,2006,2005,2004,2003,2002,2001,2000,1999,1998,1997,1996,1995,1994,1993,1992,1991,1990,1989,1988,1987,1986,1985,1984,1983,1982,1981,1980,1979,1978,1977,1976,1975,1974,1973,1972,1971,1970,1969,1968,1967,1966,1965,1964,1963,1962,1961
This statistics in other country:
AfghanistanAlbaniaAlgeriaAngolaAntigua and BarbudaArab WorldArgentinaArmeniaArubaAzerbaijanBahamas, TheBahrainBangladeshBarbadosBelarusBelizeBeninBermudaBhutanBoliviaBosnia and HerzegovinaBotswanaBrazilBritish Virgin IslandsBrunei DarussalamBurkina FasoBurundiCabo VerdeCambodiaCameroonCaribbean small statesCayman IslandsCentral African RepublicCentral Europe and the BalticsChadChileChinaColombiaComorosCongo, Dem. Rep.Congo, Rep.Costa RicaCote d'IvoireCroatiaCubaCyprusDjiboutiDominicaDominican RepublicEast Asia & PacificEast Asia & Pacific (excluding high income)East Asia & Pacific (IDA & IBRD countries)EcuadorEgypt, Arab Rep.El SalvadorEquatorial GuineaEritreaEthiopiaEuro areaEurope & Central AsiaEurope & Central Asia (excluding high income)Europe & Central Asia (IDA & IBRD countries)European UnionFijiFragile and conflict affected situationsFrench PolynesiaGabonGambia, TheGeorgiaGhanaGibraltarGrenadaGuatemalaGuineaGuinea-BissauGuyanaHaitiHeavily indebted poor countries (HIPC)High incomeHondurasHong Kong SAR, ChinaIBRD onlyIDA & IBRD totalIDA blendIDA onlyIDA totalIndiaIndonesiaIran, Islamic Rep.IraqIsraelJamaicaJordanKazakhstanKenyaKiribatiKorea, Dem. People’s Rep.Korea, Rep.KosovoKuwaitKyrgyz RepublicLao PDRLatin America & Caribbean Latin America & Caribbean (excluding high income)Latin America & the Caribbean (IDA & IBRD countries)Least developed countries: UN classificationLebanonLesothoLiberiaLibyaLow & middle incomeLow incomeLower middle incomeMacao SAR, ChinaMacedonia, FYRMadagascarMalawiMalaysiaMaldivesMaliMaltaMarshall IslandsMauritaniaMauritiusMexicoMicronesia, Fed. Sts.Middle East & North AfricaMiddle East & North Africa (excluding high income)Middle East & North Africa (IDA & IBRD countries)Middle incomeMoldovaMongoliaMontenegroMoroccoMozambiqueMyanmarNamibiaNauruNepalNew CaledoniaNicaraguaNigerNigeriaNorth AmericaNorthern Mariana IslandsOECD membersOmanOther small statesPacific island small statesPakistanPalauPanamaPapua New GuineaParaguayPeruPhilippinesQatarRwandaSamoaSao Tome and PrincipeSaudi ArabiaSenegalSerbiaSeychellesSierra LeoneSingaporeSloveniaSmall statesSolomon IslandsSomaliaSouth AfricaSouth AsiaSouth Asia (IDA & IBRD)South SudanSri LankaSt. Kitts and NevisSt. LuciaSt. Vincent and the GrenadinesSub-Saharan Africa Sub-Saharan Africa (excluding high income)Sub-Saharan Africa (IDA & IBRD countries)SudanSurinameSwazilandSyrian Arab RepublicTajikistanTanzaniaThailandTimor-LesteTogoTongaTrinidad and TobagoTunisiaTurkeyTurkmenistanTurks and Caicos IslandsTuvaluUgandaUkraineUnited Arab EmiratesUpper middle incomeUruguayUzbekistanVanuatuVenezuela, RBVietnamWest Bank and GazaWorldYemen, Rep.ZambiaZimbabwe Timeline:
This timeline shows a graph from 1961 to 2015 of Europe & Central Asia (IDA & IBRD countries). No data until 1960. Number of actual observations by date: 55.
Source name:
World Development Indicators
Source organization:
Development Assistance Committee of the Organisation for Economic Co-operation and Development, Geographical Distribution of Financial Flows to Developing Countries, Development Co-operation Report, and International Development Statistics database. Data are available online at: www.oecd.org/dac/stats/idsonline. World Bank population estimates are used for the denominator.
Categories, topics:
Aid Effectiveness, Economy & Growth, External Debt
Last updated:
apr 23, 2017
Indicators value changes by year
Maximum:
23.719
jan 1, 2012
At the date of observation
Value
Absolute change
Change from previous value
jan 1, 1961
0.444
+0.444
0.0%
jan 1, 1962
0.6
+0.156
35.1%
jan 1, 1963
0.721
+0.121
20.15%
jan 1, 1964
0.689
-0.032
-4.43%
jan 1, 1965
0.495
-0.195
-28.26%
jan 1, 1966
0.57
+0.076
15.27%
jan 1, 1967
0.604
+0.034
5.96%
jan 1, 1968
0.582
-0.022
-3.7%
jan 1, 1969
0.508
-0.074
-12.66%
jan 1, 1970
0.495
-0.013
-2.47%
jan 1, 1971
0.501
+0.005
1.11%
jan 1, 1972
0.574
+0.073
14.61%
jan 1, 1973
0.648
+0.074
12.93%
jan 1, 1974
0.229
-0.42
-64.72%
jan 1, 1975
0.137
-0.092
-40.12%
jan 1, 1976
0.158
+0.021
15.3%
jan 1, 1977
0.337
+0.179
113.15%
jan 1, 1978
0.246
-0.091
-26.97%
jan 1, 1979
0.46
+0.214
86.91%
jan 1, 1980
1.511
+1.052
228.94%
jan 1, 1981
2.444
+0.932
61.67%
jan 1, 1982
1.845
-0.598
-24.49%
jan 1, 1983
1.627
-0.218
-11.83%
jan 1, 1984
0.885
-0.742
-45.58%
jan 1, 1985
0.592
-0.293
-33.12%
jan 1, 1986
0.439
-0.153
-25.87%
jan 1, 1987
0.821
+0.382
86.91%
jan 1, 1988
0.906
+0.085
10.38%
jan 1, 1989
0.681
-0.225
-24.85%
jan 1, 1990
0.365
-0.316
-46.43%
jan 1, 1991
3.069
+2.704
741.59%
jan 1, 1992
4.78
+1.711
55.75%
jan 1, 1993
2.049
-2.731
-57.14%
jan 1, 1994
2.779
+0.73
35.64%
jan 1, 1995
4.371
+1.592
57.31%
jan 1, 1996
6.352
+1.981
45.32%
jan 1, 1997
6.665
+0.313
4.93%
jan 1, 1998
5.871
-0.794
-11.92%
jan 1, 1999
6.509
+0.639
10.88%
jan 1, 2000
9.889
+3.379
51.91%
jan 1, 2001
9.712
-0.177
-1.79%
jan 1, 2002
9.911
+0.199
2.05%
jan 1, 2003
12.704
+2.793
28.18%
jan 1, 2004
10.456
-2.248
-17.69%
jan 1, 2005
10.973
+0.517
4.94%
jan 1, 2006
11.363
+0.39
3.55%
jan 1, 2007
13.729
+2.366
20.82%
jan 1, 2008
12.911
-0.818
-5.96%
jan 1, 2009
16.246
+3.336
25.84%
jan 1, 2010
17.962
+1.716
10.56%
jan 1, 2011
16.355
-1.607
-8.95%
jan 1, 2012
23.719
+7.364
45.02%
jan 1, 2013
21.935
-1.784
-7.52%
jan 1, 2014
19.456
-2.479
-11.3%
jan 1, 2015
22.446
+2.99
15.37%
Ranking of countries by current statistics by years


Comments: