29
/
en
AIzaSyAYiBZKx7MnpbEhh9jyipgxe19OcubqV5w
April 1, 2024
233917
Sao Tome and Principe
STP
true
2
1
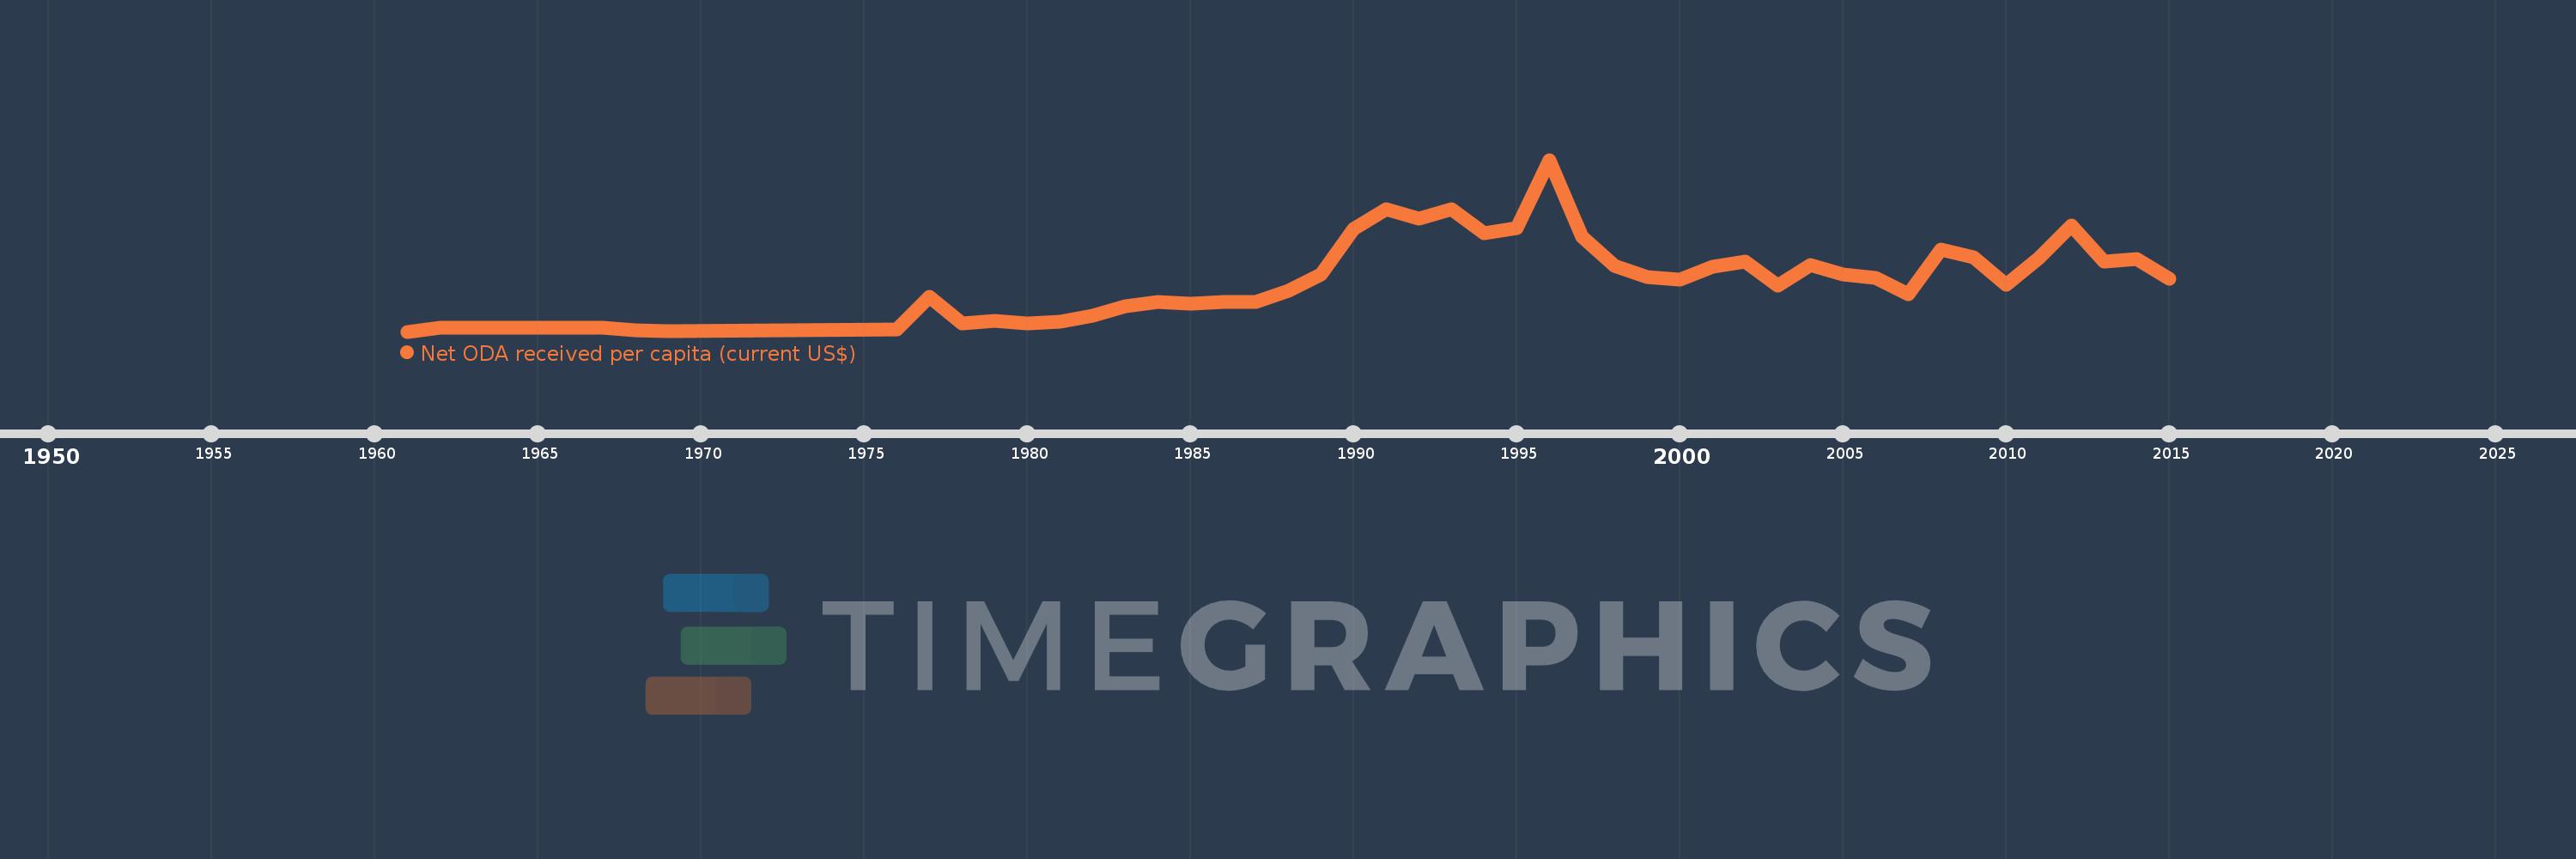
Net ODA received per capita (current US$)
2015,2014,2013,2012,2011,2010,2009,2008,2007,2006,2005,2004,2003,2002,2001,2000,1999,1998,1997,1996,1995,1994,1993,1992,1991,1990,1989,1988,1987,1986,1985,1984,1983,1982,1981,1980,1979,1978,1977,1976,1969,1968,1967,1962,1961
This statistics in other country:
AfghanistanAlbaniaAlgeriaAngolaAntigua and BarbudaArab WorldArgentinaArmeniaArubaAzerbaijanBahamas, TheBahrainBangladeshBarbadosBelarusBelizeBeninBermudaBhutanBoliviaBosnia and HerzegovinaBotswanaBrazilBritish Virgin IslandsBrunei DarussalamBurkina FasoBurundiCabo VerdeCambodiaCameroonCaribbean small statesCayman IslandsCentral African RepublicCentral Europe and the BalticsChadChileChinaColombiaComorosCongo, Dem. Rep.Congo, Rep.Costa RicaCote d'IvoireCroatiaCubaCyprusDjiboutiDominicaDominican RepublicEast Asia & PacificEast Asia & Pacific (excluding high income)East Asia & Pacific (IDA & IBRD countries)EcuadorEgypt, Arab Rep.El SalvadorEquatorial GuineaEritreaEthiopiaEuro areaEurope & Central AsiaEurope & Central Asia (excluding high income)Europe & Central Asia (IDA & IBRD countries)European UnionFijiFragile and conflict affected situationsFrench PolynesiaGabonGambia, TheGeorgiaGhanaGibraltarGrenadaGuatemalaGuineaGuinea-BissauGuyanaHaitiHeavily indebted poor countries (HIPC)High incomeHondurasHong Kong SAR, ChinaIBRD onlyIDA & IBRD totalIDA blendIDA onlyIDA totalIndiaIndonesiaIran, Islamic Rep.IraqIsraelJamaicaJordanKazakhstanKenyaKiribatiKorea, Dem. People’s Rep.Korea, Rep.KosovoKuwaitKyrgyz RepublicLao PDRLatin America & Caribbean Latin America & Caribbean (excluding high income)Latin America & the Caribbean (IDA & IBRD countries)Least developed countries: UN classificationLebanonLesothoLiberiaLibyaLow & middle incomeLow incomeLower middle incomeMacao SAR, ChinaMacedonia, FYRMadagascarMalawiMalaysiaMaldivesMaliMaltaMarshall IslandsMauritaniaMauritiusMexicoMicronesia, Fed. Sts.Middle East & North AfricaMiddle East & North Africa (excluding high income)Middle East & North Africa (IDA & IBRD countries)Middle incomeMoldovaMongoliaMontenegroMoroccoMozambiqueMyanmarNamibiaNauruNepalNew CaledoniaNicaraguaNigerNigeriaNorth AmericaNorthern Mariana IslandsOECD membersOmanOther small statesPacific island small statesPakistanPalauPanamaPapua New GuineaParaguayPeruPhilippinesQatarRwandaSamoaSao Tome and PrincipeSaudi ArabiaSenegalSerbiaSeychellesSierra LeoneSingaporeSloveniaSmall statesSolomon IslandsSomaliaSouth AfricaSouth AsiaSouth Asia (IDA & IBRD)South SudanSri LankaSt. Kitts and NevisSt. LuciaSt. Vincent and the GrenadinesSub-Saharan Africa Sub-Saharan Africa (excluding high income)Sub-Saharan Africa (IDA & IBRD countries)SudanSurinameSwazilandSyrian Arab RepublicTajikistanTanzaniaThailandTimor-LesteTogoTongaTrinidad and TobagoTunisiaTurkeyTurkmenistanTurks and Caicos IslandsTuvaluUgandaUkraineUnited Arab EmiratesUpper middle incomeUruguayUzbekistanVanuatuVenezuela, RBVietnamWest Bank and GazaWorldYemen, Rep.ZambiaZimbabwe Timeline:
This timeline shows a graph from 1961 to 2015 of Sao Tome and Principe. No data until 1960. Number of actual observations by date: 45.
Source name:
World Development Indicators
Source organization:
Development Assistance Committee of the Organisation for Economic Co-operation and Development, Geographical Distribution of Financial Flows to Developing Countries, Development Co-operation Report, and International Development Statistics database. Data are available online at: www.oecd.org/dac/stats/idsonline. World Bank population estimates are used for the denominator.
Categories, topics:
Aid Effectiveness, Economy & Growth, External Debt
Last updated:
apr 23, 2017
Indicators value changes by year
Maximum:
669.006
jan 1, 1996
At the date of observation
Value
Absolute change
Change from previous value
jan 1, 1961
1.712
+1.712
0.0%
jan 1, 1962
15.647
+13.935
814.0%
jan 1, 1967
16.047
+0.4
2.55%
jan 1, 1968
5.599
-10.448
-65.11%
jan 1, 1969
2.998
-2.6
-46.45%
jan 1, 1976
10.169
+7.17
239.15%
jan 1, 1977
137.238
+127.069
1.25K%
jan 1, 1978
34.768
-102.47
-74.67%
jan 1, 1979
44.176
+9.407
27.06%
jan 1, 1980
31.84
-12.336
-27.92%
jan 1, 1981
40.23
+8.391
26.35%
jan 1, 1982
61.889
+21.659
53.84%
jan 1, 1983
99.704
+37.815
61.1%
jan 1, 1984
115.471
+15.767
15.81%
jan 1, 1985
109.648
-5.822
-5.04%
jan 1, 1986
117.906
+8.258
7.53%
jan 1, 1987
117.213
-0.693
-0.59%
jan 1, 1988
160.538
+43.326
36.96%
jan 1, 1989
223.579
+63.04
39.27%
jan 1, 1990
399.558
+175.98
78.71%
jan 1, 1991
476.513
+76.955
19.26%
jan 1, 1992
440.121
-36.393
-7.64%
jan 1, 1993
476.822
+36.701
8.34%
jan 1, 1994
384.695
-92.127
-19.32%
jan 1, 1995
404.888
+20.193
5.25%
jan 1, 1996
669.006
+264.118
65.23%
jan 1, 1997
370.469
-298.537
-44.62%
jan 1, 1998
256.86
-113.609
-30.67%
jan 1, 1999
212.119
-44.74
-17.42%
jan 1, 2000
204.455
-7.665
-3.61%
jan 1, 2001
254.367
+49.912
24.41%
jan 1, 2002
273.994
+19.627
7.72%
jan 1, 2003
181.151
-92.843
-33.89%
jan 1, 2004
259.502
+78.351
43.25%
jan 1, 2005
224.601
-34.901
-13.45%
jan 1, 2006
211.824
-12.777
-5.69%
jan 1, 2007
146.439
-65.385
-30.87%
jan 1, 2008
319.185
+172.746
117.96%
jan 1, 2009
289.312
-29.873
-9.36%
jan 1, 2010
182.48
-106.832
-36.93%
jan 1, 2011
288.507
+106.026
58.1%
jan 1, 2012
414.496
+125.989
43.67%
jan 1, 2013
273.358
-141.138
-34.05%
jan 1, 2014
283.903
+10.546
3.86%
jan 1, 2015
207.039
-76.865
-27.07%
Ranking of countries by current statistics by years


Comments: