29
/
en
AIzaSyAYiBZKx7MnpbEhh9jyipgxe19OcubqV5w
April 1, 2024
190625
Mali
MLI
true
2
1
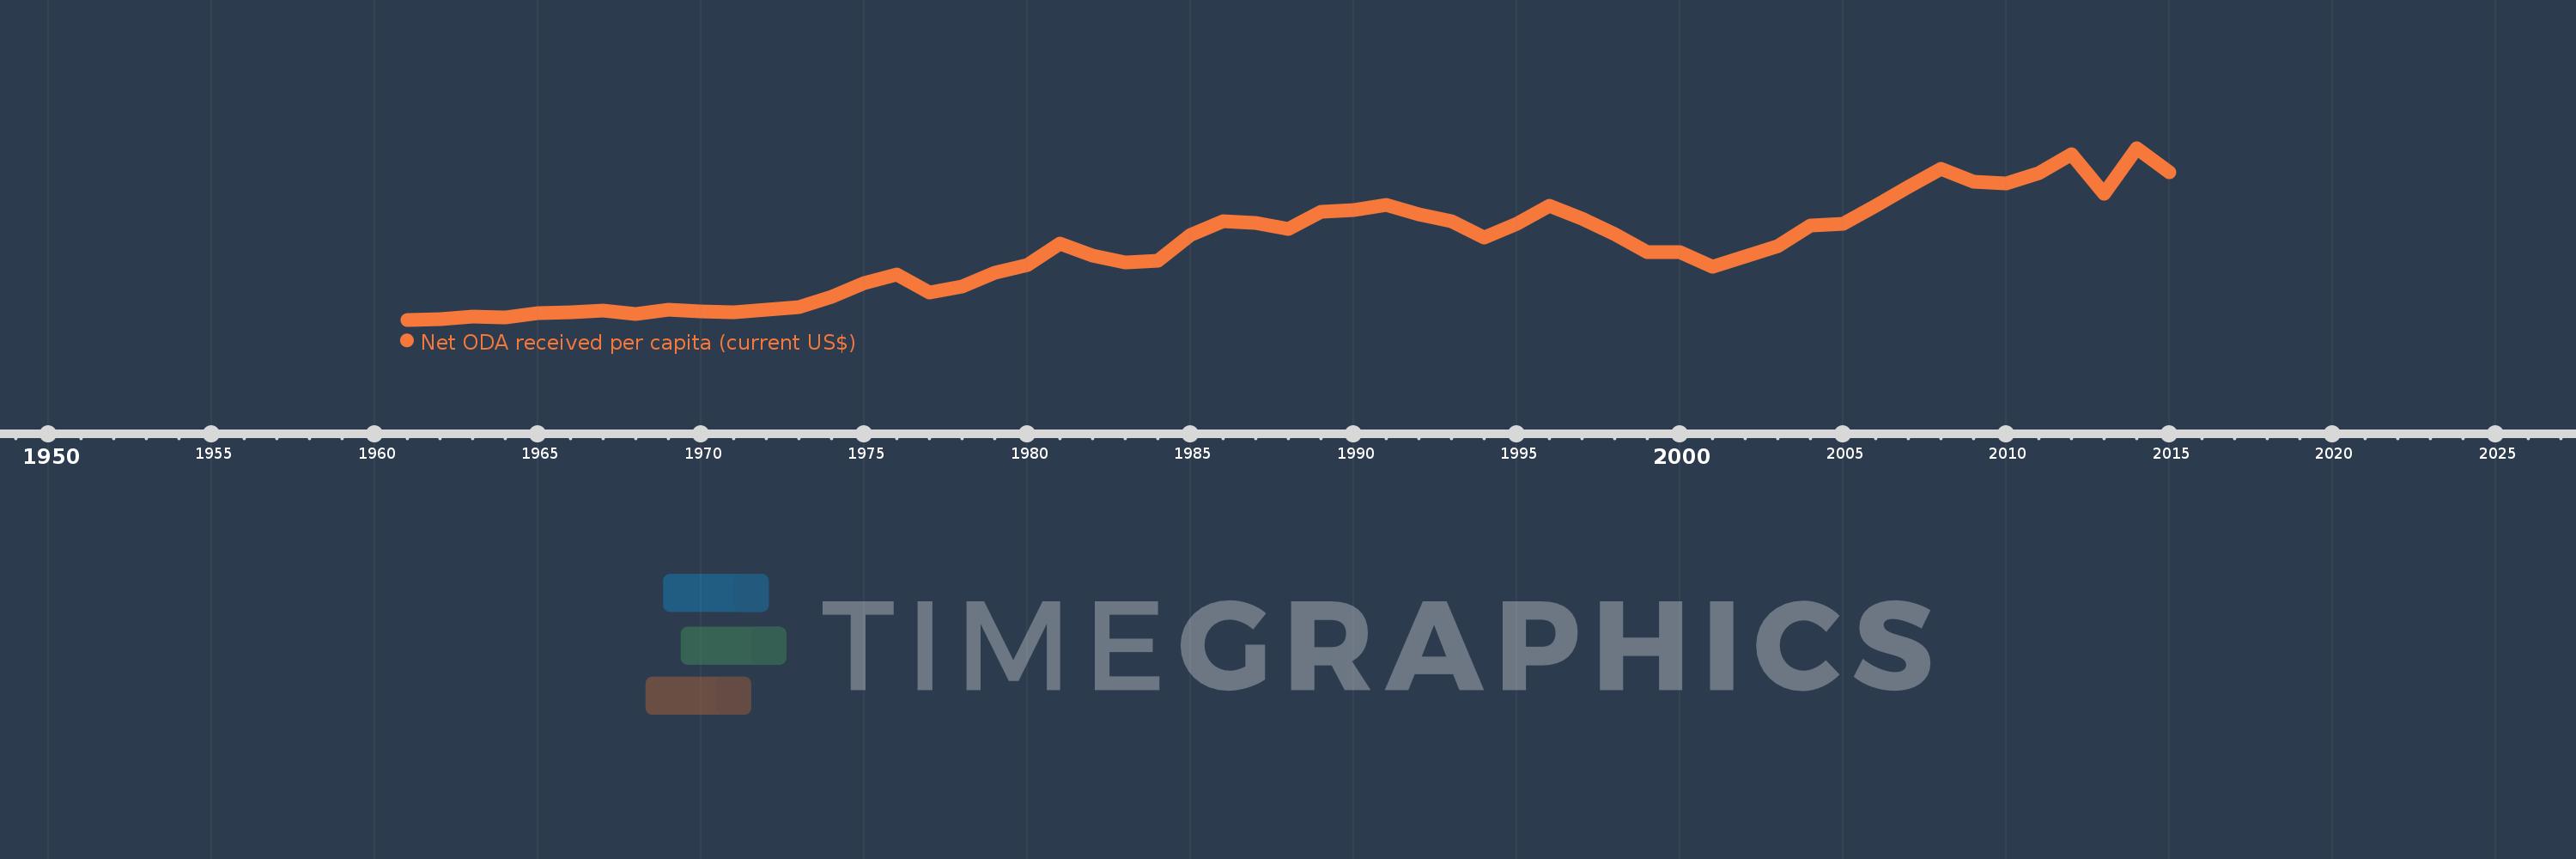
Net ODA received per capita (current US$)
2015,2014,2013,2012,2011,2010,2009,2008,2007,2006,2005,2004,2003,2002,2001,2000,1999,1998,1997,1996,1995,1994,1993,1992,1991,1990,1989,1988,1987,1986,1985,1984,1983,1982,1981,1980,1979,1978,1977,1976,1975,1974,1973,1972,1971,1970,1969,1968,1967,1966,1965,1964,1963,1962,1961
This statistics in other country:
AfghanistanAlbaniaAlgeriaAngolaAntigua and BarbudaArab WorldArgentinaArmeniaArubaAzerbaijanBahamas, TheBahrainBangladeshBarbadosBelarusBelizeBeninBermudaBhutanBoliviaBosnia and HerzegovinaBotswanaBrazilBritish Virgin IslandsBrunei DarussalamBurkina FasoBurundiCabo VerdeCambodiaCameroonCaribbean small statesCayman IslandsCentral African RepublicCentral Europe and the BalticsChadChileChinaColombiaComorosCongo, Dem. Rep.Congo, Rep.Costa RicaCote d'IvoireCroatiaCubaCyprusDjiboutiDominicaDominican RepublicEast Asia & PacificEast Asia & Pacific (excluding high income)East Asia & Pacific (IDA & IBRD countries)EcuadorEgypt, Arab Rep.El SalvadorEquatorial GuineaEritreaEthiopiaEuro areaEurope & Central AsiaEurope & Central Asia (excluding high income)Europe & Central Asia (IDA & IBRD countries)European UnionFijiFragile and conflict affected situationsFrench PolynesiaGabonGambia, TheGeorgiaGhanaGibraltarGrenadaGuatemalaGuineaGuinea-BissauGuyanaHaitiHeavily indebted poor countries (HIPC)High incomeHondurasHong Kong SAR, ChinaIBRD onlyIDA & IBRD totalIDA blendIDA onlyIDA totalIndiaIndonesiaIran, Islamic Rep.IraqIsraelJamaicaJordanKazakhstanKenyaKiribatiKorea, Dem. People’s Rep.Korea, Rep.KosovoKuwaitKyrgyz RepublicLao PDRLatin America & Caribbean Latin America & Caribbean (excluding high income)Latin America & the Caribbean (IDA & IBRD countries)Least developed countries: UN classificationLebanonLesothoLiberiaLibyaLow & middle incomeLow incomeLower middle incomeMacao SAR, ChinaMacedonia, FYRMadagascarMalawiMalaysiaMaldivesMaliMaltaMarshall IslandsMauritaniaMauritiusMexicoMicronesia, Fed. Sts.Middle East & North AfricaMiddle East & North Africa (excluding high income)Middle East & North Africa (IDA & IBRD countries)Middle incomeMoldovaMongoliaMontenegroMoroccoMozambiqueMyanmarNamibiaNauruNepalNew CaledoniaNicaraguaNigerNigeriaNorth AmericaNorthern Mariana IslandsOECD membersOmanOther small statesPacific island small statesPakistanPalauPanamaPapua New GuineaParaguayPeruPhilippinesQatarRwandaSamoaSao Tome and PrincipeSaudi ArabiaSenegalSerbiaSeychellesSierra LeoneSingaporeSloveniaSmall statesSolomon IslandsSomaliaSouth AfricaSouth AsiaSouth Asia (IDA & IBRD)South SudanSri LankaSt. Kitts and NevisSt. LuciaSt. Vincent and the GrenadinesSub-Saharan Africa Sub-Saharan Africa (excluding high income)Sub-Saharan Africa (IDA & IBRD countries)SudanSurinameSwazilandSyrian Arab RepublicTajikistanTanzaniaThailandTimor-LesteTogoTongaTrinidad and TobagoTunisiaTurkeyTurkmenistanTurks and Caicos IslandsTuvaluUgandaUkraineUnited Arab EmiratesUpper middle incomeUruguayUzbekistanVanuatuVenezuela, RBVietnamWest Bank and GazaWorldYemen, Rep.ZambiaZimbabwe Timeline:
This timeline shows a graph from 1961 to 2015 of Mali. No data until 1960. Number of actual observations by date: 55.
Source name:
World Development Indicators
Source organization:
Development Assistance Committee of the Organisation for Economic Co-operation and Development, Geographical Distribution of Financial Flows to Developing Countries, Development Co-operation Report, and International Development Statistics database. Data are available online at: www.oecd.org/dac/stats/idsonline. World Bank population estimates are used for the denominator.
Categories, topics:
Aid Effectiveness, Economy & Growth, External Debt
Last updated:
apr 23, 2017
Indicators value changes by year
Maximum:
84.244
jan 1, 2014
At the date of observation
Value
Absolute change
Change from previous value
jan 1, 1961
0.015
+0.015
0.0%
jan 1, 1962
0.458
+0.443
2.92K%
jan 1, 1963
1.776
+1.318
287.5%
jan 1, 1964
1.307
-0.47
-26.45%
jan 1, 1965
3.132
+1.826
139.74%
jan 1, 1966
3.881
+0.748
23.89%
jan 1, 1967
4.427
+0.546
14.08%
jan 1, 1968
3.014
-1.413
-31.91%
jan 1, 1969
4.825
+1.81
60.06%
jan 1, 1970
3.962
-0.863
-17.89%
jan 1, 1971
3.713
-0.248
-6.27%
jan 1, 1972
4.937
+1.223
32.95%
jan 1, 1973
6.151
+1.214
24.59%
jan 1, 1974
11.286
+5.136
83.5%
jan 1, 1975
18.198
+6.911
61.24%
jan 1, 1976
22.21
+4.012
22.05%
jan 1, 1977
13.194
-9.016
-40.59%
jan 1, 1978
16.417
+3.223
24.43%
jan 1, 1979
22.993
+6.576
40.06%
jan 1, 1980
26.956
+3.963
17.24%
jan 1, 1981
37.576
+10.62
39.4%
jan 1, 1982
31.52
-6.056
-16.12%
jan 1, 1983
28.273
-3.247
-10.3%
jan 1, 1984
28.952
+0.68
2.4%
jan 1, 1985
41.543
+12.59
43.49%
jan 1, 1986
48.347
+6.804
16.38%
jan 1, 1987
47.59
-0.757
-1.57%
jan 1, 1988
44.611
-2.979
-6.26%
jan 1, 1989
53.16
+8.549
19.16%
jan 1, 1990
53.73
+0.57
1.07%
jan 1, 1991
56.492
+2.762
5.14%
jan 1, 1992
51.851
-4.641
-8.22%
jan 1, 1993
48.328
-3.523
-6.79%
jan 1, 1994
40.46
-7.868
-16.28%
jan 1, 1995
46.853
+6.393
15.8%
jan 1, 1996
56.004
+9.151
19.53%
jan 1, 1997
49.456
-6.547
-11.69%
jan 1, 1998
42.167
-7.29
-14.74%
jan 1, 1999
33.193
-8.973
-21.28%
jan 1, 2000
32.997
-0.197
-0.59%
jan 1, 2001
26.071
-6.926
-20.99%
jan 1, 2002
30.925
+4.855
18.62%
jan 1, 2003
36.251
+5.326
17.22%
jan 1, 2004
46.257
+10.006
27.6%
jan 1, 2005
47.122
+0.865
1.87%
jan 1, 2006
55.997
+8.875
18.83%
jan 1, 2007
65.048
+9.051
16.16%
jan 1, 2008
74.036
+8.988
13.82%
jan 1, 2009
67.782
-6.254
-8.45%
jan 1, 2010
66.99
-0.792
-1.17%
jan 1, 2011
71.794
+4.804
7.17%
jan 1, 2012
81.04
+9.246
12.88%
jan 1, 2013
61.683
-19.357
-23.89%
jan 1, 2014
84.244
+22.562
36.58%
jan 1, 2015
72.196
-12.048
-14.3%
Ranking of countries by current statistics by years


Comments: