29
/
en
AIzaSyAYiBZKx7MnpbEhh9jyipgxe19OcubqV5w
April 1, 2024
56478
Small states
SST
false
2
1
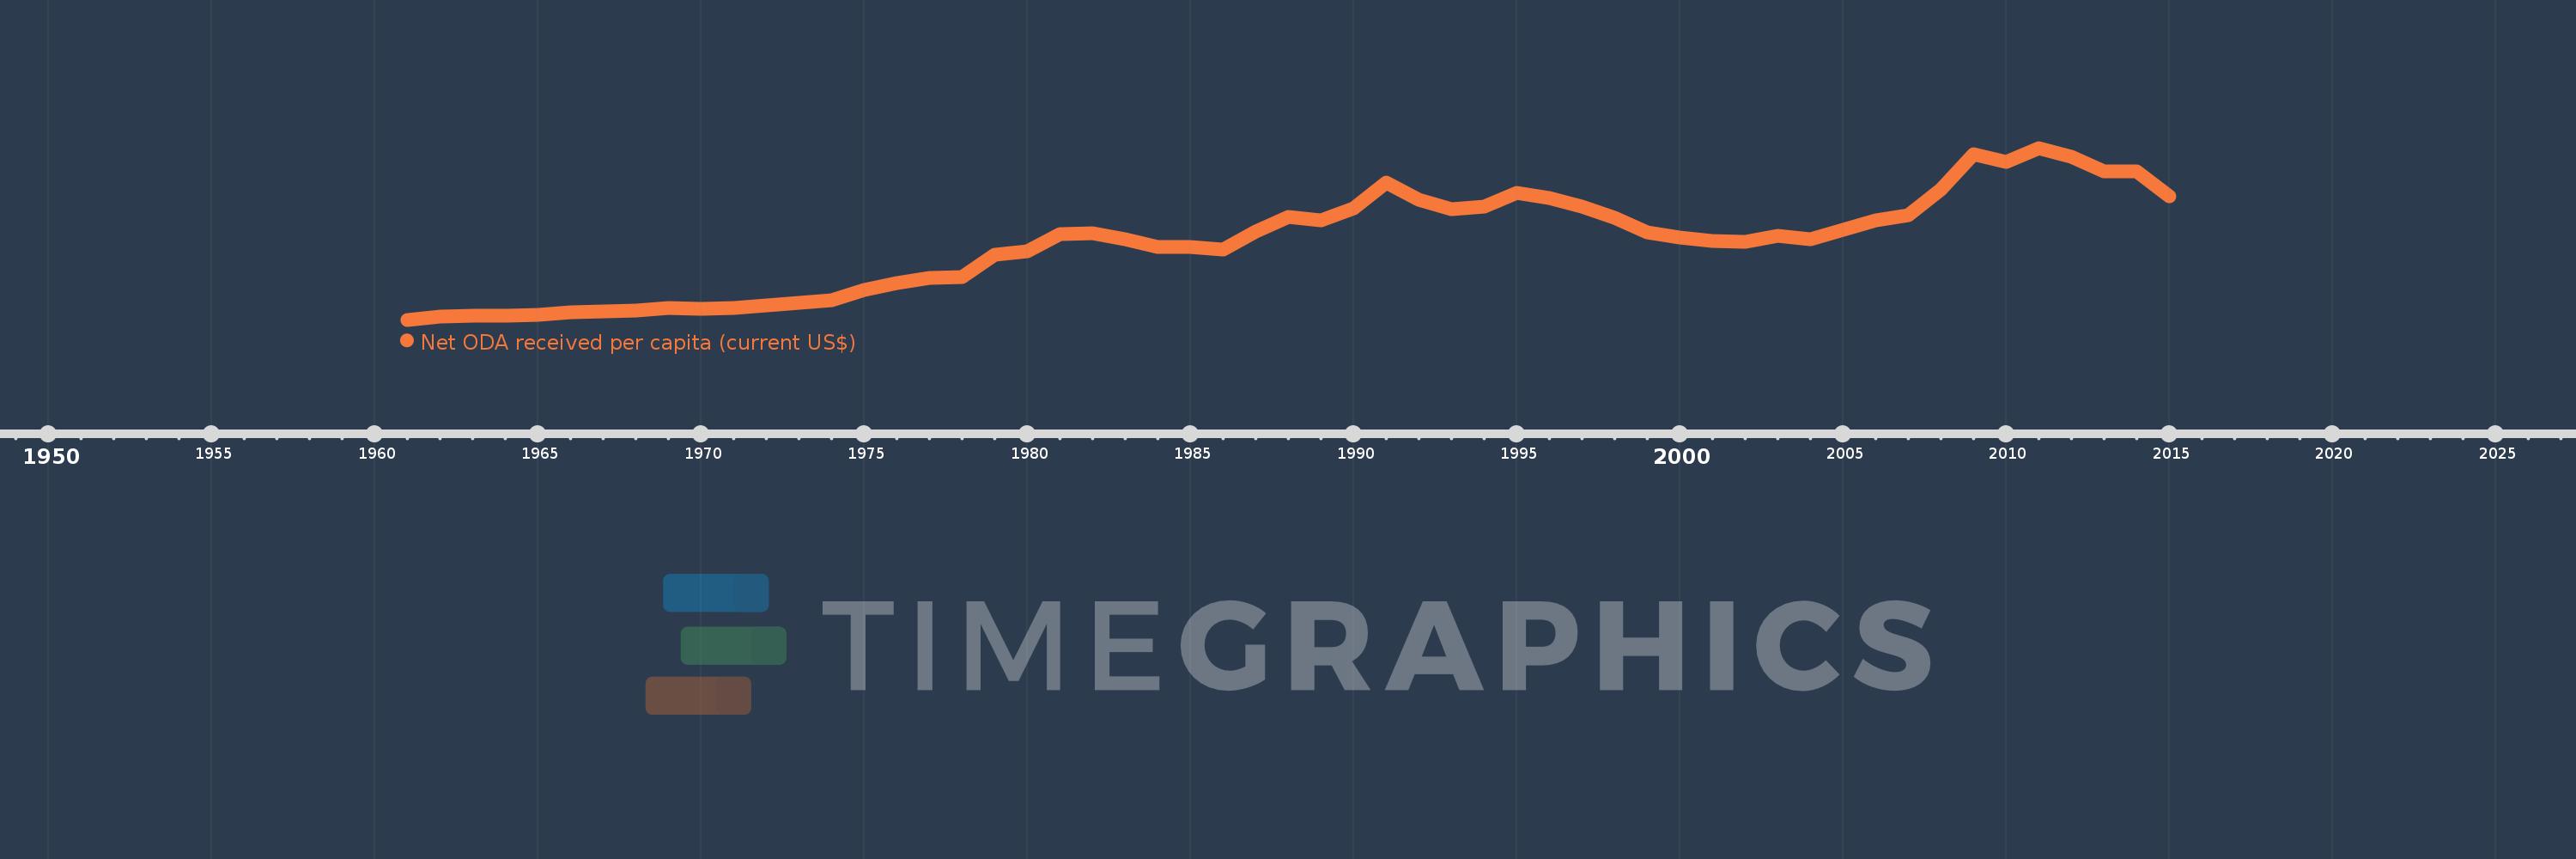
Net ODA received per capita (current US$)
2015,2014,2013,2012,2011,2010,2009,2008,2007,2006,2005,2004,2003,2002,2001,2000,1999,1998,1997,1996,1995,1994,1993,1992,1991,1990,1989,1988,1987,1986,1985,1984,1983,1982,1981,1980,1979,1978,1977,1976,1975,1974,1973,1972,1971,1970,1969,1968,1967,1966,1965,1964,1963,1962,1961
This statistics in other country:
AfghanistanAlbaniaAlgeriaAngolaAntigua and BarbudaArab WorldArgentinaArmeniaArubaAzerbaijanBahamas, TheBahrainBangladeshBarbadosBelarusBelizeBeninBermudaBhutanBoliviaBosnia and HerzegovinaBotswanaBrazilBritish Virgin IslandsBrunei DarussalamBurkina FasoBurundiCabo VerdeCambodiaCameroonCaribbean small statesCayman IslandsCentral African RepublicCentral Europe and the BalticsChadChileChinaColombiaComorosCongo, Dem. Rep.Congo, Rep.Costa RicaCote d'IvoireCroatiaCubaCyprusDjiboutiDominicaDominican RepublicEast Asia & PacificEast Asia & Pacific (excluding high income)East Asia & Pacific (IDA & IBRD countries)EcuadorEgypt, Arab Rep.El SalvadorEquatorial GuineaEritreaEthiopiaEuro areaEurope & Central AsiaEurope & Central Asia (excluding high income)Europe & Central Asia (IDA & IBRD countries)European UnionFijiFragile and conflict affected situationsFrench PolynesiaGabonGambia, TheGeorgiaGhanaGibraltarGrenadaGuatemalaGuineaGuinea-BissauGuyanaHaitiHeavily indebted poor countries (HIPC)High incomeHondurasHong Kong SAR, ChinaIBRD onlyIDA & IBRD totalIDA blendIDA onlyIDA totalIndiaIndonesiaIran, Islamic Rep.IraqIsraelJamaicaJordanKazakhstanKenyaKiribatiKorea, Dem. People’s Rep.Korea, Rep.KosovoKuwaitKyrgyz RepublicLao PDRLatin America & Caribbean Latin America & Caribbean (excluding high income)Latin America & the Caribbean (IDA & IBRD countries)Least developed countries: UN classificationLebanonLesothoLiberiaLibyaLow & middle incomeLow incomeLower middle incomeMacao SAR, ChinaMacedonia, FYRMadagascarMalawiMalaysiaMaldivesMaliMaltaMarshall IslandsMauritaniaMauritiusMexicoMicronesia, Fed. Sts.Middle East & North AfricaMiddle East & North Africa (excluding high income)Middle East & North Africa (IDA & IBRD countries)Middle incomeMoldovaMongoliaMontenegroMoroccoMozambiqueMyanmarNamibiaNauruNepalNew CaledoniaNicaraguaNigerNigeriaNorth AmericaNorthern Mariana IslandsOECD membersOmanOther small statesPacific island small statesPakistanPalauPanamaPapua New GuineaParaguayPeruPhilippinesQatarRwandaSamoaSao Tome and PrincipeSaudi ArabiaSenegalSerbiaSeychellesSierra LeoneSingaporeSloveniaSmall statesSolomon IslandsSomaliaSouth AfricaSouth AsiaSouth Asia (IDA & IBRD)South SudanSri LankaSt. Kitts and NevisSt. LuciaSt. Vincent and the GrenadinesSub-Saharan Africa Sub-Saharan Africa (excluding high income)Sub-Saharan Africa (IDA & IBRD countries)SudanSurinameSwazilandSyrian Arab RepublicTajikistanTanzaniaThailandTimor-LesteTogoTongaTrinidad and TobagoTunisiaTurkeyTurkmenistanTurks and Caicos IslandsTuvaluUgandaUkraineUnited Arab EmiratesUpper middle incomeUruguayUzbekistanVanuatuVenezuela, RBVietnamWest Bank and GazaWorldYemen, Rep.ZambiaZimbabwe Timeline:
This timeline shows a graph from 1961 to 2015 of Small states. No data until 1960. Number of actual observations by date: 55.
Source name:
World Development Indicators
Source organization:
Development Assistance Committee of the Organisation for Economic Co-operation and Development, Geographical Distribution of Financial Flows to Developing Countries, Development Co-operation Report, and International Development Statistics database. Data are available online at: www.oecd.org/dac/stats/idsonline. World Bank population estimates are used for the denominator.
Categories, topics:
Aid Effectiveness, Economy & Growth, External Debt
Last updated:
apr 23, 2017
Indicators value changes by year
Maximum:
116.324
jan 1, 2011
At the date of observation
Value
Absolute change
Change from previous value
jan 1, 1961
2.603
+2.603
0.0%
jan 1, 1962
4.977
+2.375
91.24%
jan 1, 1963
5.293
+0.316
6.34%
jan 1, 1964
5.36
+0.067
1.26%
jan 1, 1965
5.848
+0.488
9.11%
jan 1, 1966
7.554
+1.706
29.17%
jan 1, 1967
8.354
+0.8
10.59%
jan 1, 1968
8.463
+0.11
1.31%
jan 1, 1969
10.322
+1.858
21.96%
jan 1, 1970
10.009
-0.313
-3.03%
jan 1, 1971
10.254
+0.245
2.45%
jan 1, 1972
12.089
+1.834
17.89%
jan 1, 1973
14.021
+1.933
15.99%
jan 1, 1974
15.631
+1.61
11.48%
jan 1, 1975
22.054
+6.423
41.09%
jan 1, 1976
26.913
+4.859
22.03%
jan 1, 1977
30.198
+3.285
12.2%
jan 1, 1978
30.726
+0.528
1.75%
jan 1, 1979
45.843
+15.117
49.2%
jan 1, 1980
47.708
+1.866
4.07%
jan 1, 1981
59.083
+11.374
23.84%
jan 1, 1982
59.585
+0.502
0.85%
jan 1, 1983
55.905
-3.68
-6.18%
jan 1, 1984
50.97
-4.935
-8.83%
jan 1, 1985
50.962
-0.008
-0.02%
jan 1, 1986
49.243
-1.719
-3.37%
jan 1, 1987
60.831
+11.588
23.53%
jan 1, 1988
70.512
+9.681
15.91%
jan 1, 1989
68.631
-1.881
-2.67%
jan 1, 1990
76.089
+7.458
10.87%
jan 1, 1991
93.628
+17.539
23.05%
jan 1, 1992
81.943
-11.685
-12.48%
jan 1, 1993
75.922
-6.021
-7.35%
jan 1, 1994
77.333
+1.411
1.86%
jan 1, 1995
86.537
+9.204
11.9%
jan 1, 1996
83.088
-3.449
-3.99%
jan 1, 1997
77.394
-5.694
-6.85%
jan 1, 1998
70.085
-7.309
-9.44%
jan 1, 1999
60.345
-9.739
-13.9%
jan 1, 2000
57.108
-3.237
-5.36%
jan 1, 2001
54.788
-2.32
-4.06%
jan 1, 2002
54.021
-0.767
-1.4%
jan 1, 2003
57.921
+3.901
7.22%
jan 1, 2004
55.734
-2.187
-3.78%
jan 1, 2005
62.104
+6.369
11.43%
jan 1, 2006
68.229
+6.125
9.86%
jan 1, 2007
72.043
+3.814
5.59%
jan 1, 2008
88.886
+16.843
23.38%
jan 1, 2009
112.177
+23.291
26.2%
jan 1, 2010
107.277
-4.9
-4.37%
jan 1, 2011
116.324
+9.047
8.43%
jan 1, 2012
110.462
-5.862
-5.04%
jan 1, 2013
100.994
-9.468
-8.57%
jan 1, 2014
100.918
-0.077
-0.08%
jan 1, 2015
84.266
-16.652
-16.5%
Ranking of countries by current statistics by years


Comments: