29
/
en
AIzaSyAYiBZKx7MnpbEhh9jyipgxe19OcubqV5w
April 1, 2024
223979
Philippines
PHL
true
2
1
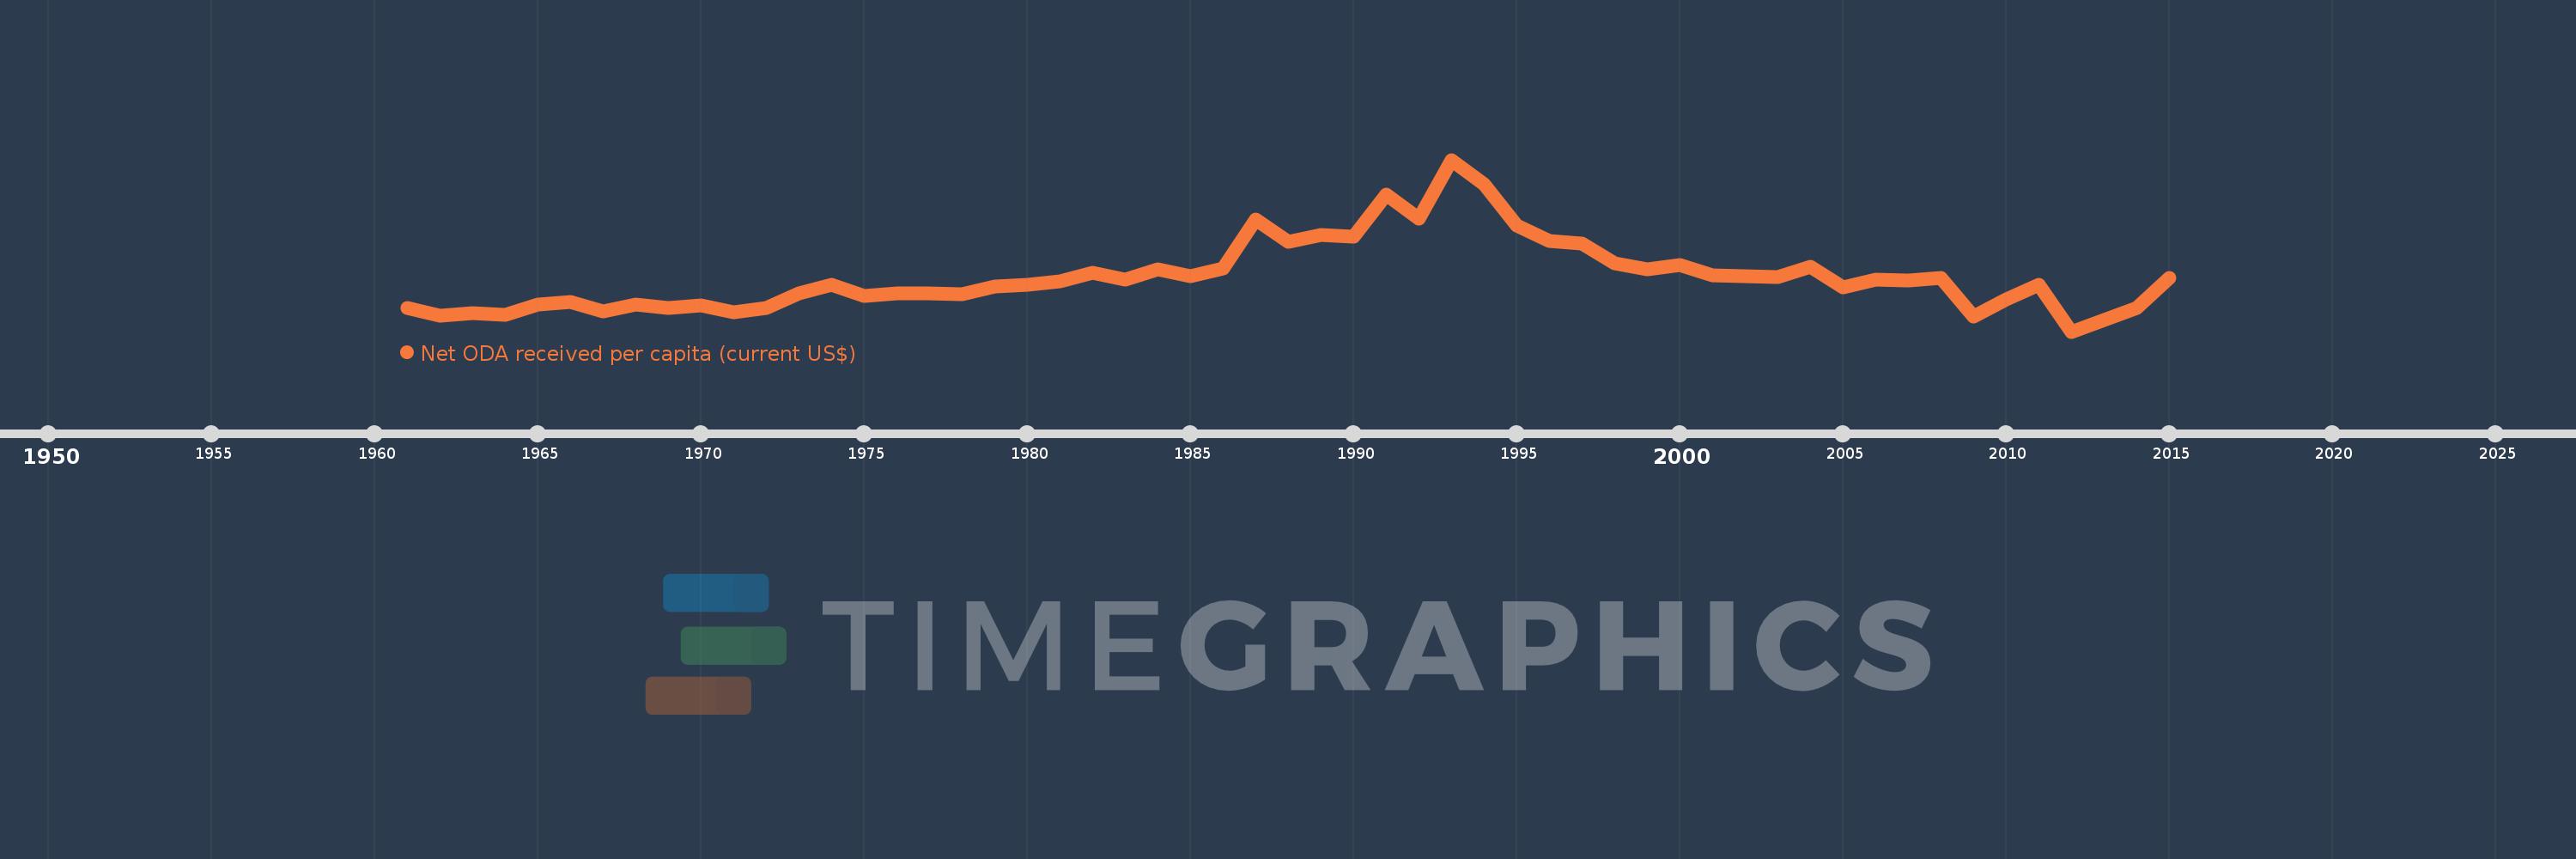
Net ODA received per capita (current US$)
2015,2014,2013,2012,2011,2010,2009,2008,2007,2006,2005,2004,2003,2002,2001,2000,1999,1998,1997,1996,1995,1994,1993,1992,1991,1990,1989,1988,1987,1986,1985,1984,1983,1982,1981,1980,1979,1978,1977,1976,1975,1974,1973,1972,1971,1970,1969,1968,1967,1966,1965,1964,1963,1962,1961
This statistics in other country:
AfghanistanAlbaniaAlgeriaAngolaAntigua and BarbudaArab WorldArgentinaArmeniaArubaAzerbaijanBahamas, TheBahrainBangladeshBarbadosBelarusBelizeBeninBermudaBhutanBoliviaBosnia and HerzegovinaBotswanaBrazilBritish Virgin IslandsBrunei DarussalamBurkina FasoBurundiCabo VerdeCambodiaCameroonCaribbean small statesCayman IslandsCentral African RepublicCentral Europe and the BalticsChadChileChinaColombiaComorosCongo, Dem. Rep.Congo, Rep.Costa RicaCote d'IvoireCroatiaCubaCyprusDjiboutiDominicaDominican RepublicEast Asia & PacificEast Asia & Pacific (excluding high income)East Asia & Pacific (IDA & IBRD countries)EcuadorEgypt, Arab Rep.El SalvadorEquatorial GuineaEritreaEthiopiaEuro areaEurope & Central AsiaEurope & Central Asia (excluding high income)Europe & Central Asia (IDA & IBRD countries)European UnionFijiFragile and conflict affected situationsFrench PolynesiaGabonGambia, TheGeorgiaGhanaGibraltarGrenadaGuatemalaGuineaGuinea-BissauGuyanaHaitiHeavily indebted poor countries (HIPC)High incomeHondurasHong Kong SAR, ChinaIBRD onlyIDA & IBRD totalIDA blendIDA onlyIDA totalIndiaIndonesiaIran, Islamic Rep.IraqIsraelJamaicaJordanKazakhstanKenyaKiribatiKorea, Dem. People’s Rep.Korea, Rep.KosovoKuwaitKyrgyz RepublicLao PDRLatin America & Caribbean Latin America & Caribbean (excluding high income)Latin America & the Caribbean (IDA & IBRD countries)Least developed countries: UN classificationLebanonLesothoLiberiaLibyaLow & middle incomeLow incomeLower middle incomeMacao SAR, ChinaMacedonia, FYRMadagascarMalawiMalaysiaMaldivesMaliMaltaMarshall IslandsMauritaniaMauritiusMexicoMicronesia, Fed. Sts.Middle East & North AfricaMiddle East & North Africa (excluding high income)Middle East & North Africa (IDA & IBRD countries)Middle incomeMoldovaMongoliaMontenegroMoroccoMozambiqueMyanmarNamibiaNauruNepalNew CaledoniaNicaraguaNigerNigeriaNorth AmericaNorthern Mariana IslandsOECD membersOmanOther small statesPacific island small statesPakistanPalauPanamaPapua New GuineaParaguayPeruPhilippinesQatarRwandaSamoaSao Tome and PrincipeSaudi ArabiaSenegalSerbiaSeychellesSierra LeoneSingaporeSloveniaSmall statesSolomon IslandsSomaliaSouth AfricaSouth AsiaSouth Asia (IDA & IBRD)South SudanSri LankaSt. Kitts and NevisSt. LuciaSt. Vincent and the GrenadinesSub-Saharan Africa Sub-Saharan Africa (excluding high income)Sub-Saharan Africa (IDA & IBRD countries)SudanSurinameSwazilandSyrian Arab RepublicTajikistanTanzaniaThailandTimor-LesteTogoTongaTrinidad and TobagoTunisiaTurkeyTurkmenistanTurks and Caicos IslandsTuvaluUgandaUkraineUnited Arab EmiratesUpper middle incomeUruguayUzbekistanVanuatuVenezuela, RBVietnamWest Bank and GazaWorldYemen, Rep.ZambiaZimbabwe Timeline:
This timeline shows a graph from 1961 to 2015 of Philippines. No data until 1960. Number of actual observations by date: 55.
Source name:
World Development Indicators
Source organization:
Development Assistance Committee of the Organisation for Economic Co-operation and Development, Geographical Distribution of Financial Flows to Developing Countries, Development Co-operation Report, and International Development Statistics database. Data are available online at: www.oecd.org/dac/stats/idsonline. World Bank population estimates are used for the denominator.
Categories, topics:
Aid Effectiveness, Economy & Growth, External Debt
Last updated:
apr 23, 2017
Indicators value changes by year
Minimum:
-1.943
jan 1, 2012
Maximum:
26.269
jan 1, 1993
At the date of observation
Value
Absolute change
Change from previous value
jan 1, 1961
1.969
+1.969
0.0%
jan 1, 1962
0.699
-1.27
-64.48%
jan 1, 1963
1.086
+0.387
55.34%
jan 1, 1964
0.757
-0.33
-30.34%
jan 1, 1965
2.442
+1.686
222.72%
jan 1, 1966
2.989
+0.547
22.38%
jan 1, 1967
1.319
-1.67
-55.88%
jan 1, 1968
2.527
+1.209
91.66%
jan 1, 1969
1.929
-0.598
-23.65%
jan 1, 1970
2.317
+0.387
20.08%
jan 1, 1971
1.286
-1.031
-44.5%
jan 1, 1972
1.976
+0.69
53.68%
jan 1, 1973
4.304
+2.328
117.79%
jan 1, 1974
5.692
+1.388
32.25%
jan 1, 1975
3.922
-1.77
-31.1%
jan 1, 1976
4.282
+0.361
9.2%
jan 1, 1977
4.356
+0.074
1.72%
jan 1, 1978
4.15
-0.206
-4.73%
jan 1, 1979
5.517
+1.367
32.94%
jan 1, 1980
5.79
+0.273
4.94%
jan 1, 1981
6.299
+0.509
8.79%
jan 1, 1982
7.694
+1.396
22.16%
jan 1, 1983
6.61
-1.084
-14.09%
jan 1, 1984
8.223
+1.613
24.4%
jan 1, 1985
7.189
-1.034
-12.57%
jan 1, 1986
8.445
+1.256
17.48%
jan 1, 1987
16.468
+8.023
94.99%
jan 1, 1988
12.751
-3.717
-22.57%
jan 1, 1989
13.919
+1.168
9.16%
jan 1, 1990
13.619
-0.301
-2.16%
jan 1, 1991
20.511
+6.893
50.61%
jan 1, 1992
16.537
-3.975
-19.38%
jan 1, 1993
26.269
+9.732
58.85%
jan 1, 1994
22.209
-4.06
-15.46%
jan 1, 1995
15.443
-6.765
-30.46%
jan 1, 1996
12.921
-2.523
-16.33%
jan 1, 1997
12.573
-0.348
-2.69%
jan 1, 1998
9.308
-3.265
-25.97%
jan 1, 1999
8.223
-1.085
-11.65%
jan 1, 2000
8.995
+0.772
9.38%
jan 1, 2001
7.336
-1.659
-18.44%
jan 1, 2002
7.147
-0.189
-2.58%
jan 1, 2003
7.002
-0.144
-2.02%
jan 1, 2004
8.701
+1.699
24.26%
jan 1, 2005
5.308
-3.393
-39.0%
jan 1, 2006
6.584
+1.276
24.04%
jan 1, 2007
6.449
-0.134
-2.04%
jan 1, 2008
6.857
+0.408
6.33%
jan 1, 2009
0.531
-6.326
-92.25%
jan 1, 2010
3.375
+2.843
534.99%
jan 1, 2011
5.695
+2.32
68.74%
jan 1, 2012
-1.943
-7.637
-134.11%
jan 1, 2013
-0.027
+1.916
-98.62%
jan 1, 2014
1.952
+1.979
-7.36K%
jan 1, 2015
6.816
+4.864
249.24%
Ranking of countries by current statistics by years


Comments: