29
/
en
AIzaSyAYiBZKx7MnpbEhh9jyipgxe19OcubqV5w
April 1, 2024
37629
IDA & IBRD total
IBT
false
2
1
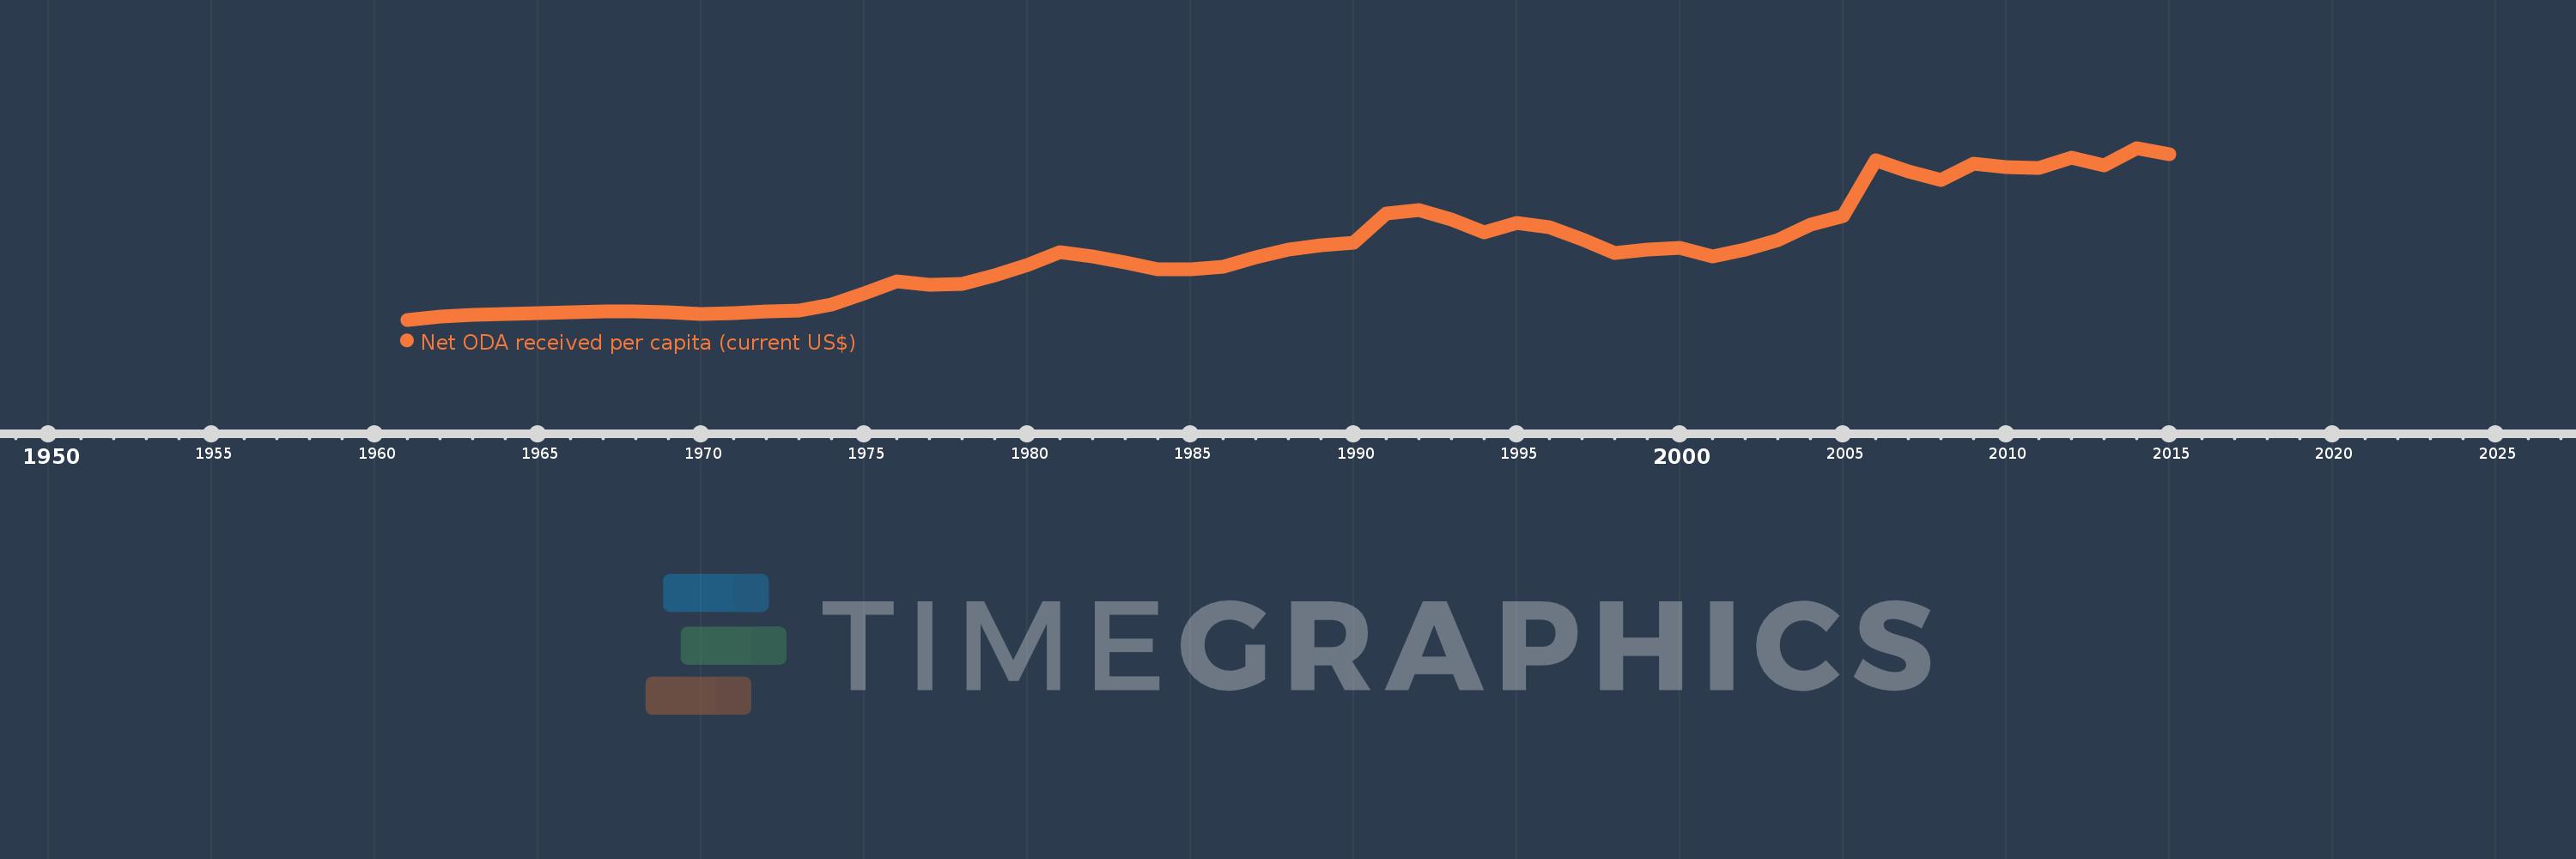
Net ODA received per capita (current US$)
2015,2014,2013,2012,2011,2010,2009,2008,2007,2006,2005,2004,2003,2002,2001,2000,1999,1998,1997,1996,1995,1994,1993,1992,1991,1990,1989,1988,1987,1986,1985,1984,1983,1982,1981,1980,1979,1978,1977,1976,1975,1974,1973,1972,1971,1970,1969,1968,1967,1966,1965,1964,1963,1962,1961
This statistics in other country:
AfghanistanAlbaniaAlgeriaAngolaAntigua and BarbudaArab WorldArgentinaArmeniaArubaAzerbaijanBahamas, TheBahrainBangladeshBarbadosBelarusBelizeBeninBermudaBhutanBoliviaBosnia and HerzegovinaBotswanaBrazilBritish Virgin IslandsBrunei DarussalamBurkina FasoBurundiCabo VerdeCambodiaCameroonCaribbean small statesCayman IslandsCentral African RepublicCentral Europe and the BalticsChadChileChinaColombiaComorosCongo, Dem. Rep.Congo, Rep.Costa RicaCote d'IvoireCroatiaCubaCyprusDjiboutiDominicaDominican RepublicEast Asia & PacificEast Asia & Pacific (excluding high income)East Asia & Pacific (IDA & IBRD countries)EcuadorEgypt, Arab Rep.El SalvadorEquatorial GuineaEritreaEthiopiaEuro areaEurope & Central AsiaEurope & Central Asia (excluding high income)Europe & Central Asia (IDA & IBRD countries)European UnionFijiFragile and conflict affected situationsFrench PolynesiaGabonGambia, TheGeorgiaGhanaGibraltarGrenadaGuatemalaGuineaGuinea-BissauGuyanaHaitiHeavily indebted poor countries (HIPC)High incomeHondurasHong Kong SAR, ChinaIBRD onlyIDA & IBRD totalIDA blendIDA onlyIDA totalIndiaIndonesiaIran, Islamic Rep.IraqIsraelJamaicaJordanKazakhstanKenyaKiribatiKorea, Dem. People’s Rep.Korea, Rep.KosovoKuwaitKyrgyz RepublicLao PDRLatin America & Caribbean Latin America & Caribbean (excluding high income)Latin America & the Caribbean (IDA & IBRD countries)Least developed countries: UN classificationLebanonLesothoLiberiaLibyaLow & middle incomeLow incomeLower middle incomeMacao SAR, ChinaMacedonia, FYRMadagascarMalawiMalaysiaMaldivesMaliMaltaMarshall IslandsMauritaniaMauritiusMexicoMicronesia, Fed. Sts.Middle East & North AfricaMiddle East & North Africa (excluding high income)Middle East & North Africa (IDA & IBRD countries)Middle incomeMoldovaMongoliaMontenegroMoroccoMozambiqueMyanmarNamibiaNauruNepalNew CaledoniaNicaraguaNigerNigeriaNorth AmericaNorthern Mariana IslandsOECD membersOmanOther small statesPacific island small statesPakistanPalauPanamaPapua New GuineaParaguayPeruPhilippinesQatarRwandaSamoaSao Tome and PrincipeSaudi ArabiaSenegalSerbiaSeychellesSierra LeoneSingaporeSloveniaSmall statesSolomon IslandsSomaliaSouth AfricaSouth AsiaSouth Asia (IDA & IBRD)South SudanSri LankaSt. Kitts and NevisSt. LuciaSt. Vincent and the GrenadinesSub-Saharan Africa Sub-Saharan Africa (excluding high income)Sub-Saharan Africa (IDA & IBRD countries)SudanSurinameSwazilandSyrian Arab RepublicTajikistanTanzaniaThailandTimor-LesteTogoTongaTrinidad and TobagoTunisiaTurkeyTurkmenistanTurks and Caicos IslandsTuvaluUgandaUkraineUnited Arab EmiratesUpper middle incomeUruguayUzbekistanVanuatuVenezuela, RBVietnamWest Bank and GazaWorldYemen, Rep.ZambiaZimbabwe Timeline:
This timeline shows a graph from 1961 to 2015 of IDA & IBRD total. No data until 1960. Number of actual observations by date: 55.
Source name:
World Development Indicators
Source organization:
Development Assistance Committee of the Organisation for Economic Co-operation and Development, Geographical Distribution of Financial Flows to Developing Countries, Development Co-operation Report, and International Development Statistics database. Data are available online at: www.oecd.org/dac/stats/idsonline. World Bank population estimates are used for the denominator.
Categories, topics:
Aid Effectiveness, Economy & Growth, External Debt
Last updated:
apr 23, 2017
Indicators value changes by year
Maximum:
16.877
jan 1, 2014
At the date of observation
Value
Absolute change
Change from previous value
jan 1, 1961
1.383
+1.383
0.0%
jan 1, 1962
1.699
+0.316
22.88%
jan 1, 1963
1.801
+0.102
6.03%
jan 1, 1964
1.935
+0.133
7.41%
jan 1, 1965
1.974
+0.039
2.04%
jan 1, 1966
2.089
+0.115
5.82%
jan 1, 1967
2.146
+0.057
2.71%
jan 1, 1968
2.147
+0.001
0.04%
jan 1, 1969
2.045
-0.101
-4.72%
jan 1, 1970
1.918
-0.128
-6.24%
jan 1, 1971
2.004
+0.086
4.5%
jan 1, 1972
2.14
+0.136
6.79%
jan 1, 1973
2.174
+0.034
1.58%
jan 1, 1974
2.745
+0.571
26.27%
jan 1, 1975
3.755
+1.009
36.77%
jan 1, 1976
4.831
+1.076
28.67%
jan 1, 1977
4.538
-0.293
-6.07%
jan 1, 1978
4.599
+0.061
1.35%
jan 1, 1979
5.39
+0.791
17.19%
jan 1, 1980
6.303
+0.913
16.94%
jan 1, 1981
7.456
+1.153
18.29%
jan 1, 1982
7.111
-0.346
-4.64%
jan 1, 1983
6.525
-0.586
-8.24%
jan 1, 1984
5.956
-0.569
-8.72%
jan 1, 1985
5.909
-0.047
-0.79%
jan 1, 1986
6.189
+0.281
4.75%
jan 1, 1987
7.009
+0.82
13.24%
jan 1, 1988
7.712
+0.704
10.04%
jan 1, 1989
8.125
+0.412
5.35%
jan 1, 1990
8.325
+0.2
2.46%
jan 1, 1991
10.964
+2.64
31.71%
jan 1, 1992
11.251
+0.286
2.61%
jan 1, 1993
10.418
-0.833
-7.4%
jan 1, 1994
9.233
-1.185
-11.38%
jan 1, 1995
10.082
+0.849
9.19%
jan 1, 1996
9.717
-0.364
-3.61%
jan 1, 1997
8.638
-1.079
-11.11%
jan 1, 1998
7.438
-1.2
-13.89%
jan 1, 1999
7.735
+0.297
3.99%
jan 1, 2000
7.83
+0.095
1.23%
jan 1, 2001
7.11
-0.72
-9.19%
jan 1, 2002
7.699
+0.589
8.28%
jan 1, 2003
8.594
+0.895
11.62%
jan 1, 2004
9.955
+1.361
15.84%
jan 1, 2005
10.714
+0.759
7.63%
jan 1, 2006
15.794
+5.079
47.41%
jan 1, 2007
14.76
-1.034
-6.55%
jan 1, 2008
13.976
-0.784
-5.31%
jan 1, 2009
15.457
+1.481
10.6%
jan 1, 2010
15.119
-0.338
-2.19%
jan 1, 2011
15.1
-0.019
-0.12%
jan 1, 2012
16.039
+0.939
6.22%
jan 1, 2013
15.286
-0.753
-4.69%
jan 1, 2014
16.877
+1.591
10.41%
jan 1, 2015
16.323
-0.554
-3.28%
Ranking of countries by current statistics by years


Comments: