29
/
en
AIzaSyAYiBZKx7MnpbEhh9jyipgxe19OcubqV5w
April 1, 2024
263810
Timor-Leste
TLS
true
2
1
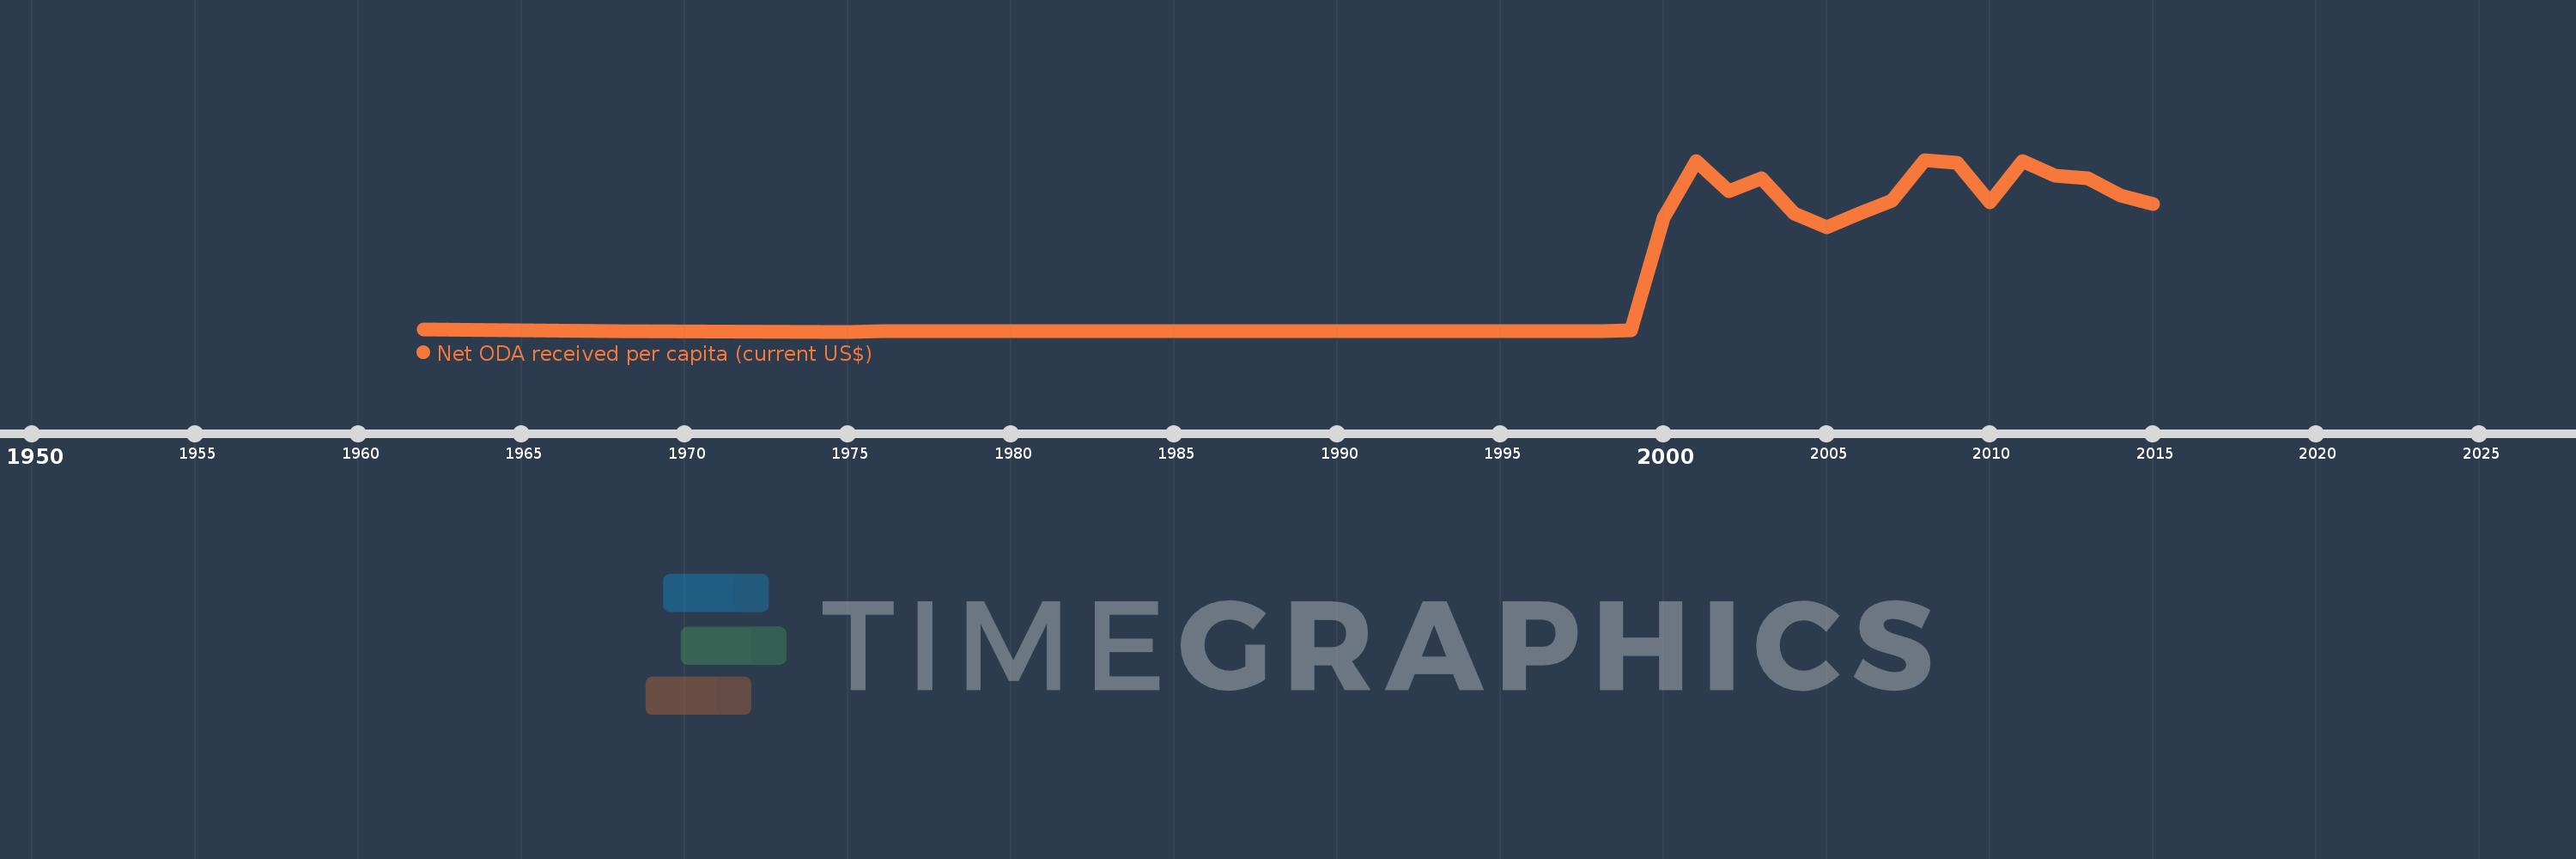
Net ODA received per capita (current US$)
2015,2014,2013,2012,2011,2010,2009,2008,2007,2006,2005,2004,2003,2002,2001,2000,1999,1998,1997,1996,1995,1994,1993,1992,1991,1989,1987,1984,1983,1982,1981,1980,1979,1977,1976,1975,1968,1962
This statistics in other country:
AfghanistanAlbaniaAlgeriaAngolaAntigua and BarbudaArab WorldArgentinaArmeniaArubaAzerbaijanBahamas, TheBahrainBangladeshBarbadosBelarusBelizeBeninBermudaBhutanBoliviaBosnia and HerzegovinaBotswanaBrazilBritish Virgin IslandsBrunei DarussalamBurkina FasoBurundiCabo VerdeCambodiaCameroonCaribbean small statesCayman IslandsCentral African RepublicCentral Europe and the BalticsChadChileChinaColombiaComorosCongo, Dem. Rep.Congo, Rep.Costa RicaCote d'IvoireCroatiaCubaCyprusDjiboutiDominicaDominican RepublicEast Asia & PacificEast Asia & Pacific (excluding high income)East Asia & Pacific (IDA & IBRD countries)EcuadorEgypt, Arab Rep.El SalvadorEquatorial GuineaEritreaEthiopiaEuro areaEurope & Central AsiaEurope & Central Asia (excluding high income)Europe & Central Asia (IDA & IBRD countries)European UnionFijiFragile and conflict affected situationsFrench PolynesiaGabonGambia, TheGeorgiaGhanaGibraltarGrenadaGuatemalaGuineaGuinea-BissauGuyanaHaitiHeavily indebted poor countries (HIPC)High incomeHondurasHong Kong SAR, ChinaIBRD onlyIDA & IBRD totalIDA blendIDA onlyIDA totalIndiaIndonesiaIran, Islamic Rep.IraqIsraelJamaicaJordanKazakhstanKenyaKiribatiKorea, Dem. People’s Rep.Korea, Rep.KosovoKuwaitKyrgyz RepublicLao PDRLatin America & Caribbean Latin America & Caribbean (excluding high income)Latin America & the Caribbean (IDA & IBRD countries)Least developed countries: UN classificationLebanonLesothoLiberiaLibyaLow & middle incomeLow incomeLower middle incomeMacao SAR, ChinaMacedonia, FYRMadagascarMalawiMalaysiaMaldivesMaliMaltaMarshall IslandsMauritaniaMauritiusMexicoMicronesia, Fed. Sts.Middle East & North AfricaMiddle East & North Africa (excluding high income)Middle East & North Africa (IDA & IBRD countries)Middle incomeMoldovaMongoliaMontenegroMoroccoMozambiqueMyanmarNamibiaNauruNepalNew CaledoniaNicaraguaNigerNigeriaNorth AmericaNorthern Mariana IslandsOECD membersOmanOther small statesPacific island small statesPakistanPalauPanamaPapua New GuineaParaguayPeruPhilippinesQatarRwandaSamoaSao Tome and PrincipeSaudi ArabiaSenegalSerbiaSeychellesSierra LeoneSingaporeSloveniaSmall statesSolomon IslandsSomaliaSouth AfricaSouth AsiaSouth Asia (IDA & IBRD)South SudanSri LankaSt. Kitts and NevisSt. LuciaSt. Vincent and the GrenadinesSub-Saharan Africa Sub-Saharan Africa (excluding high income)Sub-Saharan Africa (IDA & IBRD countries)SudanSurinameSwazilandSyrian Arab RepublicTajikistanTanzaniaThailandTimor-LesteTogoTongaTrinidad and TobagoTunisiaTurkeyTurkmenistanTurks and Caicos IslandsTuvaluUgandaUkraineUnited Arab EmiratesUpper middle incomeUruguayUzbekistanVanuatuVenezuela, RBVietnamWest Bank and GazaWorldYemen, Rep.ZambiaZimbabwe Timeline:
This timeline shows a graph from 1962 to 2015 of Timor-Leste. No data until 1961. Number of actual observations by date: 38.
Source name:
World Development Indicators
Source organization:
Development Assistance Committee of the Organisation for Economic Co-operation and Development, Geographical Distribution of Financial Flows to Developing Countries, Development Co-operation Report, and International Development Statistics database. Data are available online at: www.oecd.org/dac/stats/idsonline. World Bank population estimates are used for the denominator.
Categories, topics:
Aid Effectiveness, Economy & Growth, External Debt
Last updated:
apr 23, 2017
Indicators value changes by year
Maximum:
274.646
jan 1, 2008
At the date of observation
Value
Absolute change
Change from previous value
jan 1, 1962
3.226
+3.226
0.0%
jan 1, 1968
0.564
-2.662
-82.52%
jan 1, 1975
0.015
-0.549
-97.32%
jan 1, 1976
0.378
+0.363
2.4K%
jan 1, 1977
0.692
+0.314
83.08%
jan 1, 1979
0.016
-0.675
-97.62%
jan 1, 1980
0.784
+0.767
4.65K%
jan 1, 1981
0.866
+0.082
10.45%
jan 1, 1982
0.431
-0.435
-50.26%
jan 1, 1983
0.387
-0.043
-10.07%
jan 1, 1984
0.732
+0.345
89.14%
jan 1, 1987
0.445
-0.287
-39.24%
jan 1, 1989
0.028
-0.417
-93.61%
jan 1, 1991
0.135
+0.107
375.32%
jan 1, 1992
1.229
+1.094
809.7%
jan 1, 1993
0.164
-1.065
-86.66%
jan 1, 1994
0.512
+0.348
212.2%
jan 1, 1995
0.273
-0.239
-46.69%
jan 1, 1996
0.023
-0.25
-91.44%
jan 1, 1997
0.093
+0.07
298.58%
jan 1, 1998
0.504
+0.411
441.04%
jan 1, 1999
1.976
+1.472
292.4%
jan 1, 2000
181.699
+179.723
9.09K%
jan 1, 2001
272.986
+91.288
50.24%
jan 1, 2002
224.254
-48.732
-17.85%
jan 1, 2003
244.793
+20.539
9.16%
jan 1, 2004
188.32
-56.474
-23.07%
jan 1, 2005
167.499
-20.821
-11.06%
jan 1, 2006
188.684
+21.186
12.65%
jan 1, 2007
209.899
+21.214
11.24%
jan 1, 2008
274.646
+64.748
30.85%
jan 1, 2009
269.292
-5.355
-1.95%
jan 1, 2010
206.454
-62.837
-23.33%
jan 1, 2011
273.16
+66.705
32.31%
jan 1, 2012
248.958
-24.202
-8.86%
jan 1, 2013
245.649
-3.309
-1.33%
jan 1, 2014
217.513
-28.136
-11.45%
jan 1, 2015
203.786
-13.727
-6.31%
Ranking of countries by current statistics by years


Comments: