29
/
en
AIzaSyAYiBZKx7MnpbEhh9jyipgxe19OcubqV5w
April 1, 2024
186902
Malawi
MWI
true
2
1
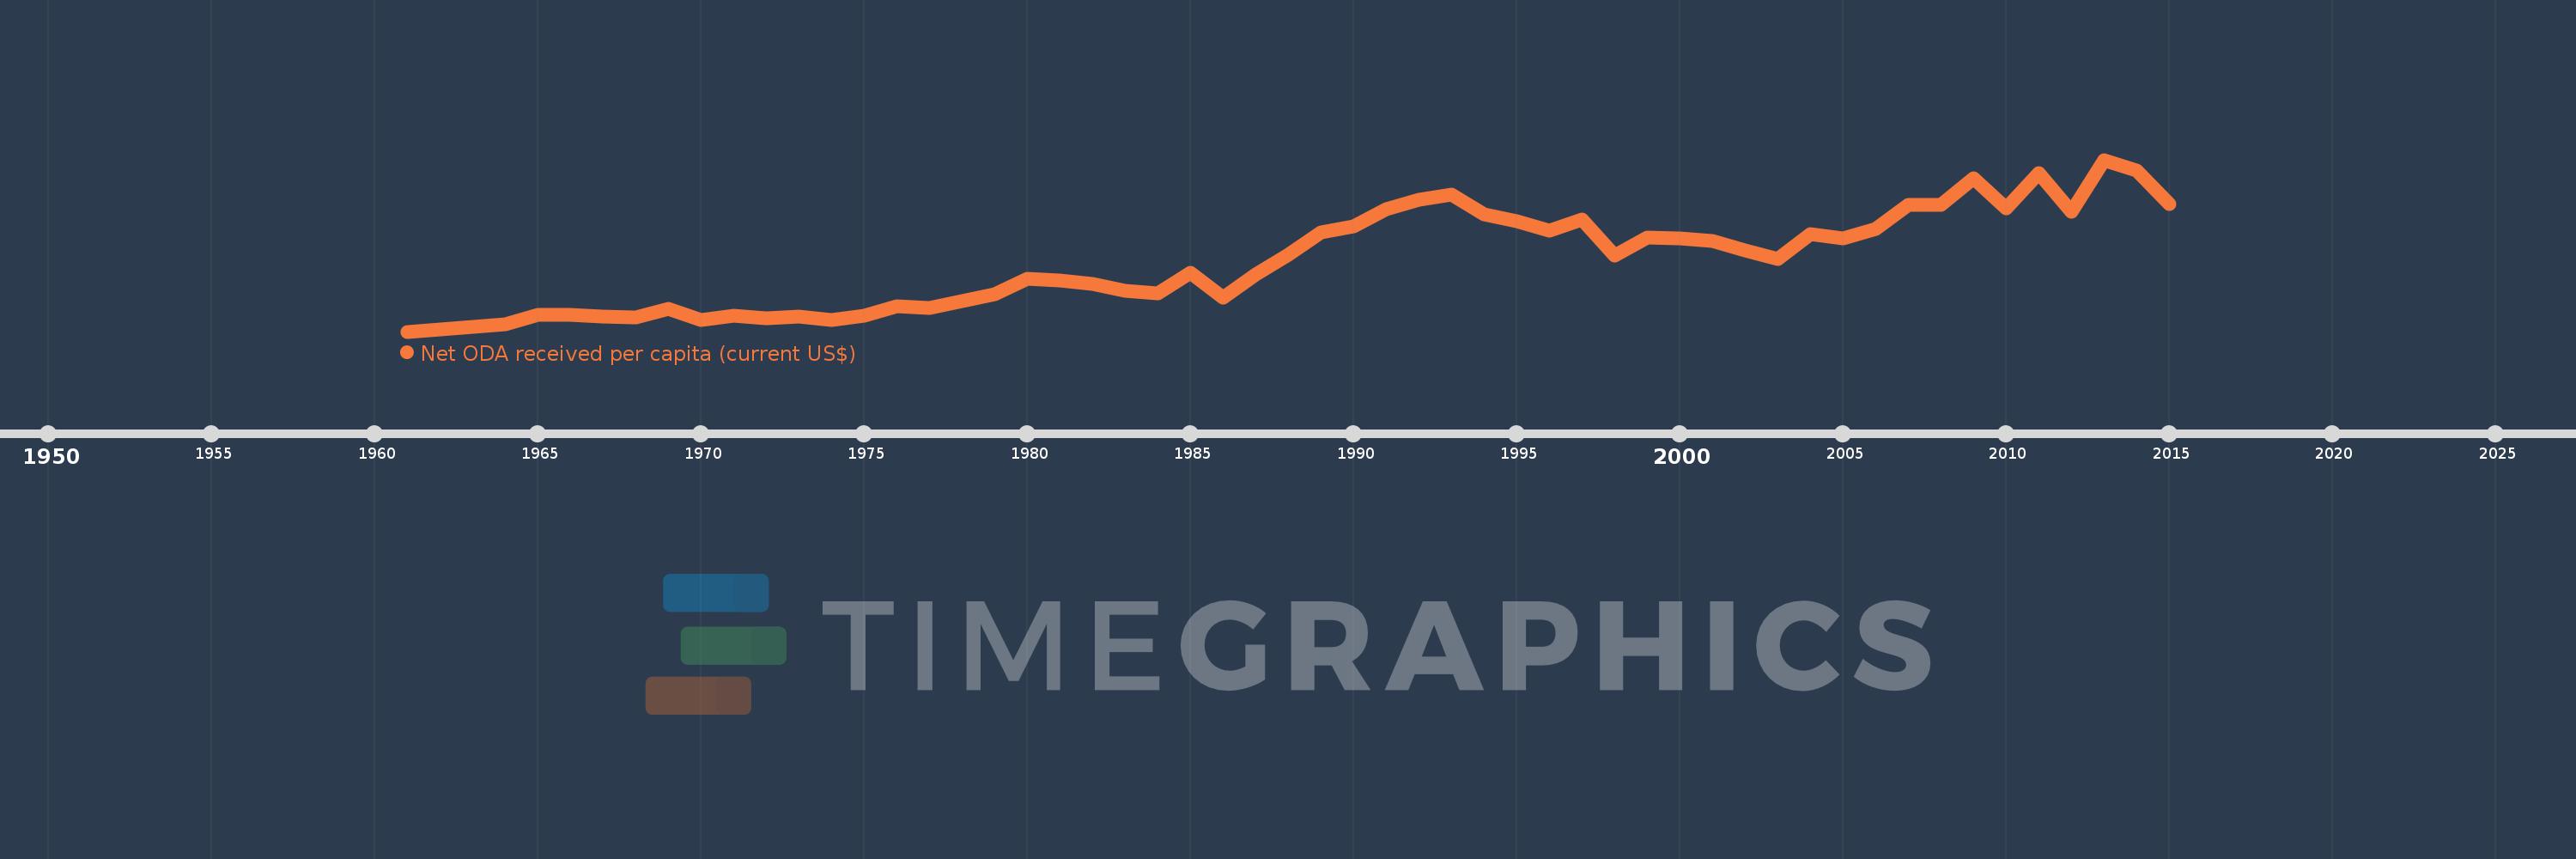
Net ODA received per capita (current US$)
2015,2014,2013,2012,2011,2010,2009,2008,2007,2006,2005,2004,2003,2002,2001,2000,1999,1998,1997,1996,1995,1994,1993,1992,1991,1990,1989,1988,1987,1986,1985,1984,1983,1982,1981,1980,1979,1978,1977,1976,1975,1974,1973,1972,1971,1970,1969,1968,1967,1966,1965,1964,1963,1962,1961
This statistics in other country:
AfghanistanAlbaniaAlgeriaAngolaAntigua and BarbudaArab WorldArgentinaArmeniaArubaAzerbaijanBahamas, TheBahrainBangladeshBarbadosBelarusBelizeBeninBermudaBhutanBoliviaBosnia and HerzegovinaBotswanaBrazilBritish Virgin IslandsBrunei DarussalamBurkina FasoBurundiCabo VerdeCambodiaCameroonCaribbean small statesCayman IslandsCentral African RepublicCentral Europe and the BalticsChadChileChinaColombiaComorosCongo, Dem. Rep.Congo, Rep.Costa RicaCote d'IvoireCroatiaCubaCyprusDjiboutiDominicaDominican RepublicEast Asia & PacificEast Asia & Pacific (excluding high income)East Asia & Pacific (IDA & IBRD countries)EcuadorEgypt, Arab Rep.El SalvadorEquatorial GuineaEritreaEthiopiaEuro areaEurope & Central AsiaEurope & Central Asia (excluding high income)Europe & Central Asia (IDA & IBRD countries)European UnionFijiFragile and conflict affected situationsFrench PolynesiaGabonGambia, TheGeorgiaGhanaGibraltarGrenadaGuatemalaGuineaGuinea-BissauGuyanaHaitiHeavily indebted poor countries (HIPC)High incomeHondurasHong Kong SAR, ChinaIBRD onlyIDA & IBRD totalIDA blendIDA onlyIDA totalIndiaIndonesiaIran, Islamic Rep.IraqIsraelJamaicaJordanKazakhstanKenyaKiribatiKorea, Dem. People’s Rep.Korea, Rep.KosovoKuwaitKyrgyz RepublicLao PDRLatin America & Caribbean Latin America & Caribbean (excluding high income)Latin America & the Caribbean (IDA & IBRD countries)Least developed countries: UN classificationLebanonLesothoLiberiaLibyaLow & middle incomeLow incomeLower middle incomeMacao SAR, ChinaMacedonia, FYRMadagascarMalawiMalaysiaMaldivesMaliMaltaMarshall IslandsMauritaniaMauritiusMexicoMicronesia, Fed. Sts.Middle East & North AfricaMiddle East & North Africa (excluding high income)Middle East & North Africa (IDA & IBRD countries)Middle incomeMoldovaMongoliaMontenegroMoroccoMozambiqueMyanmarNamibiaNauruNepalNew CaledoniaNicaraguaNigerNigeriaNorth AmericaNorthern Mariana IslandsOECD membersOmanOther small statesPacific island small statesPakistanPalauPanamaPapua New GuineaParaguayPeruPhilippinesQatarRwandaSamoaSao Tome and PrincipeSaudi ArabiaSenegalSerbiaSeychellesSierra LeoneSingaporeSloveniaSmall statesSolomon IslandsSomaliaSouth AfricaSouth AsiaSouth Asia (IDA & IBRD)South SudanSri LankaSt. Kitts and NevisSt. LuciaSt. Vincent and the GrenadinesSub-Saharan Africa Sub-Saharan Africa (excluding high income)Sub-Saharan Africa (IDA & IBRD countries)SudanSurinameSwazilandSyrian Arab RepublicTajikistanTanzaniaThailandTimor-LesteTogoTongaTrinidad and TobagoTunisiaTurkeyTurkmenistanTurks and Caicos IslandsTuvaluUgandaUkraineUnited Arab EmiratesUpper middle incomeUruguayUzbekistanVanuatuVenezuela, RBVietnamWest Bank and GazaWorldYemen, Rep.ZambiaZimbabwe Timeline:
This timeline shows a graph from 1961 to 2015 of Malawi. No data until 1960. Number of actual observations by date: 55.
Source name:
World Development Indicators
Source organization:
Development Assistance Committee of the Organisation for Economic Co-operation and Development, Geographical Distribution of Financial Flows to Developing Countries, Development Co-operation Report, and International Development Statistics database. Data are available online at: www.oecd.org/dac/stats/idsonline. World Bank population estimates are used for the denominator.
Categories, topics:
Aid Effectiveness, Economy & Growth, External Debt
Last updated:
apr 23, 2017
Indicators value changes by year
Maximum:
74.426
jan 1, 2013
At the date of observation
Value
Absolute change
Change from previous value
jan 1, 1961
1.15
+1.15
0.0%
jan 1, 1962
2.224
+1.075
93.48%
jan 1, 1963
3.068
+0.844
37.92%
jan 1, 1964
4.251
+1.183
38.56%
jan 1, 1965
8.215
+3.964
93.26%
jan 1, 1966
8.355
+0.14
1.7%
jan 1, 1967
7.626
-0.729
-8.72%
jan 1, 1968
7.048
-0.578
-7.58%
jan 1, 1969
10.737
+3.689
52.34%
jan 1, 1970
6.132
-4.605
-42.89%
jan 1, 1971
7.987
+1.855
30.24%
jan 1, 1972
6.666
-1.321
-16.54%
jan 1, 1973
7.443
+0.777
11.66%
jan 1, 1974
5.926
-1.517
-20.39%
jan 1, 1975
8.051
+2.125
35.86%
jan 1, 1976
11.88
+3.83
47.57%
jan 1, 1977
11.304
-0.577
-4.85%
jan 1, 1978
14.021
+2.718
24.04%
jan 1, 1979
16.912
+2.89
20.61%
jan 1, 1980
23.623
+6.711
39.68%
jan 1, 1981
22.907
-0.716
-3.03%
jan 1, 1982
21.595
-1.312
-5.73%
jan 1, 1983
18.544
-3.051
-14.13%
jan 1, 1984
17.342
-1.202
-6.48%
jan 1, 1985
26.307
+8.964
51.69%
jan 1, 1986
15.607
-10.7
-40.67%
jan 1, 1987
25.533
+9.926
63.6%
jan 1, 1988
34.019
+8.485
33.23%
jan 1, 1989
43.568
+9.55
28.07%
jan 1, 1990
45.993
+2.425
5.57%
jan 1, 1991
53.179
+7.186
15.62%
jan 1, 1992
57.222
+4.043
7.6%
jan 1, 1993
59.594
+2.372
4.14%
jan 1, 1994
51.182
-8.412
-14.12%
jan 1, 1995
48.34
-2.841
-5.55%
jan 1, 1996
44.197
-4.143
-8.57%
jan 1, 1997
49.121
+4.924
11.14%
jan 1, 1998
33.521
-15.6
-31.76%
jan 1, 1999
41.134
+7.613
22.71%
jan 1, 2000
41.04
-0.094
-0.23%
jan 1, 2001
39.855
-1.185
-2.89%
jan 1, 2002
35.628
-4.227
-10.61%
jan 1, 2003
32.076
-3.552
-9.97%
jan 1, 2004
42.854
+10.778
33.6%
jan 1, 2005
40.75
-2.104
-4.91%
jan 1, 2006
44.976
+4.226
10.37%
jan 1, 2007
55.123
+10.147
22.56%
jan 1, 2008
55.114
-0.009
-0.02%
jan 1, 2009
66.426
+11.312
20.52%
jan 1, 2010
53.834
-12.592
-18.96%
jan 1, 2011
68.701
+14.867
27.62%
jan 1, 2012
52.337
-16.364
-23.82%
jan 1, 2013
74.426
+22.089
42.2%
jan 1, 2014
69.768
-4.658
-6.26%
jan 1, 2015
55.716
-14.052
-20.14%
Ranking of countries by current statistics by years


Comments: