29
/
en
AIzaSyAYiBZKx7MnpbEhh9jyipgxe19OcubqV5w
April 1, 2024
193388
Mauritania
MRT
true
2
1
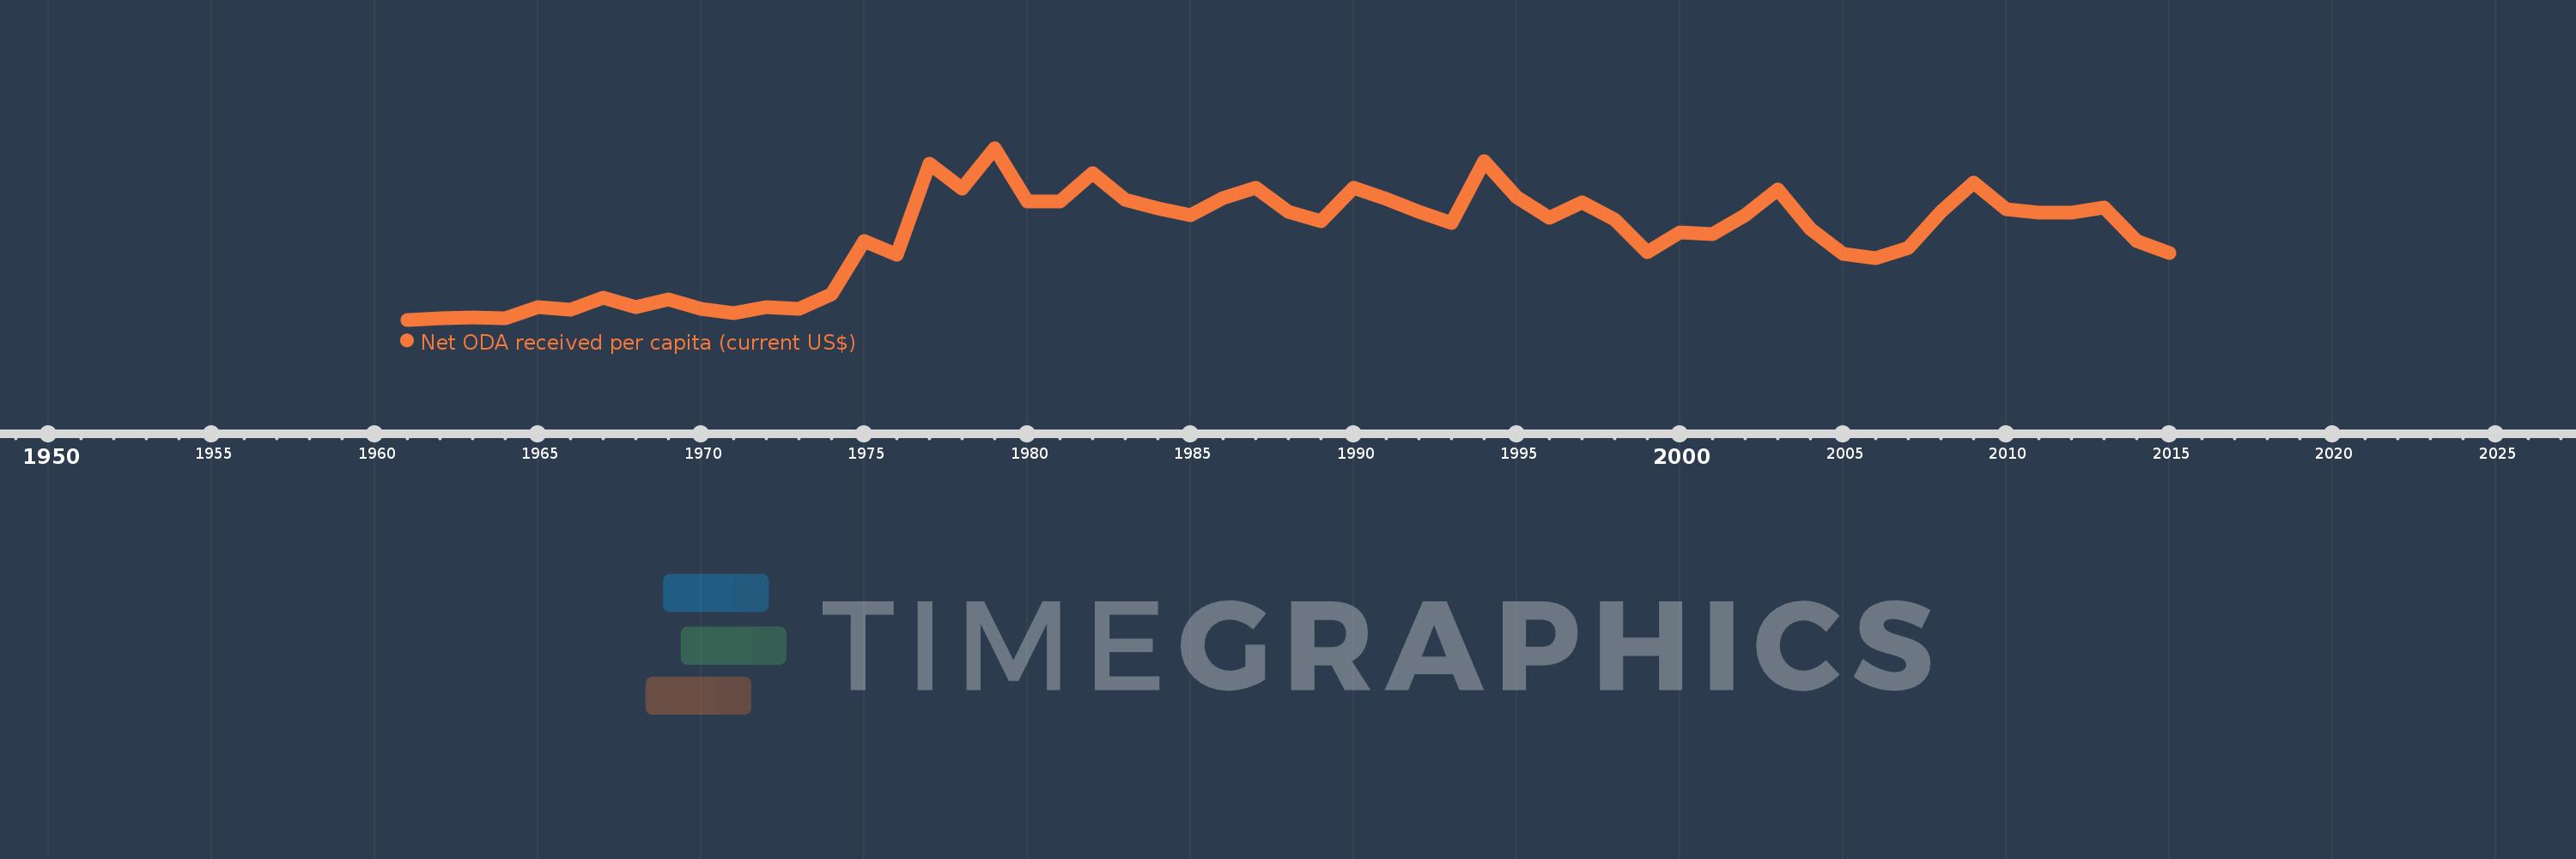
Net ODA received per capita (current US$)
2015,2014,2013,2012,2011,2010,2009,2008,2007,2006,2005,2004,2003,2002,2001,2000,1999,1998,1997,1996,1995,1994,1993,1992,1991,1990,1989,1988,1987,1986,1985,1984,1983,1982,1981,1980,1979,1978,1977,1976,1975,1974,1973,1972,1971,1970,1969,1968,1967,1966,1965,1964,1963,1962,1961
This statistics in other country:
AfghanistanAlbaniaAlgeriaAngolaAntigua and BarbudaArab WorldArgentinaArmeniaArubaAzerbaijanBahamas, TheBahrainBangladeshBarbadosBelarusBelizeBeninBermudaBhutanBoliviaBosnia and HerzegovinaBotswanaBrazilBritish Virgin IslandsBrunei DarussalamBurkina FasoBurundiCabo VerdeCambodiaCameroonCaribbean small statesCayman IslandsCentral African RepublicCentral Europe and the BalticsChadChileChinaColombiaComorosCongo, Dem. Rep.Congo, Rep.Costa RicaCote d'IvoireCroatiaCubaCyprusDjiboutiDominicaDominican RepublicEast Asia & PacificEast Asia & Pacific (excluding high income)East Asia & Pacific (IDA & IBRD countries)EcuadorEgypt, Arab Rep.El SalvadorEquatorial GuineaEritreaEthiopiaEuro areaEurope & Central AsiaEurope & Central Asia (excluding high income)Europe & Central Asia (IDA & IBRD countries)European UnionFijiFragile and conflict affected situationsFrench PolynesiaGabonGambia, TheGeorgiaGhanaGibraltarGrenadaGuatemalaGuineaGuinea-BissauGuyanaHaitiHeavily indebted poor countries (HIPC)High incomeHondurasHong Kong SAR, ChinaIBRD onlyIDA & IBRD totalIDA blendIDA onlyIDA totalIndiaIndonesiaIran, Islamic Rep.IraqIsraelJamaicaJordanKazakhstanKenyaKiribatiKorea, Dem. People’s Rep.Korea, Rep.KosovoKuwaitKyrgyz RepublicLao PDRLatin America & Caribbean Latin America & Caribbean (excluding high income)Latin America & the Caribbean (IDA & IBRD countries)Least developed countries: UN classificationLebanonLesothoLiberiaLibyaLow & middle incomeLow incomeLower middle incomeMacao SAR, ChinaMacedonia, FYRMadagascarMalawiMalaysiaMaldivesMaliMaltaMarshall IslandsMauritaniaMauritiusMexicoMicronesia, Fed. Sts.Middle East & North AfricaMiddle East & North Africa (excluding high income)Middle East & North Africa (IDA & IBRD countries)Middle incomeMoldovaMongoliaMontenegroMoroccoMozambiqueMyanmarNamibiaNauruNepalNew CaledoniaNicaraguaNigerNigeriaNorth AmericaNorthern Mariana IslandsOECD membersOmanOther small statesPacific island small statesPakistanPalauPanamaPapua New GuineaParaguayPeruPhilippinesQatarRwandaSamoaSao Tome and PrincipeSaudi ArabiaSenegalSerbiaSeychellesSierra LeoneSingaporeSloveniaSmall statesSolomon IslandsSomaliaSouth AfricaSouth AsiaSouth Asia (IDA & IBRD)South SudanSri LankaSt. Kitts and NevisSt. LuciaSt. Vincent and the GrenadinesSub-Saharan Africa Sub-Saharan Africa (excluding high income)Sub-Saharan Africa (IDA & IBRD countries)SudanSurinameSwazilandSyrian Arab RepublicTajikistanTanzaniaThailandTimor-LesteTogoTongaTrinidad and TobagoTunisiaTurkeyTurkmenistanTurks and Caicos IslandsTuvaluUgandaUkraineUnited Arab EmiratesUpper middle incomeUruguayUzbekistanVanuatuVenezuela, RBVietnamWest Bank and GazaWorldYemen, Rep.ZambiaZimbabwe Timeline:
This timeline shows a graph from 1961 to 2015 of Mauritania. No data until 1960. Number of actual observations by date: 55.
Source name:
World Development Indicators
Source organization:
Development Assistance Committee of the Organisation for Economic Co-operation and Development, Geographical Distribution of Financial Flows to Developing Countries, Development Co-operation Report, and International Development Statistics database. Data are available online at: www.oecd.org/dac/stats/idsonline. World Bank population estimates are used for the denominator.
Categories, topics:
Aid Effectiveness, Economy & Growth, External Debt
Last updated:
apr 23, 2017
Indicators value changes by year
Maximum:
165.732
jan 1, 1979
At the date of observation
Value
Absolute change
Change from previous value
jan 1, 1961
0.047
+0.047
0.0%
jan 1, 1962
1.144
+1.097
2.35K%
jan 1, 1963
2.464
+1.32
115.45%
jan 1, 1964
1.731
-0.733
-29.75%
jan 1, 1965
12.534
+10.804
624.22%
jan 1, 1966
9.372
-3.163
-25.23%
jan 1, 1967
21.235
+11.864
126.59%
jan 1, 1968
11.869
-9.366
-44.11%
jan 1, 1969
19.371
+7.501
63.2%
jan 1, 1970
10.593
-8.777
-45.31%
jan 1, 1971
6.537
-4.057
-38.3%
jan 1, 1972
12.351
+5.814
88.94%
jan 1, 1973
10.961
-1.389
-11.25%
jan 1, 1974
24.628
+13.667
124.68%
jan 1, 1975
75.909
+51.281
208.22%
jan 1, 1976
62.603
-13.306
-17.53%
jan 1, 1977
150.763
+88.16
140.82%
jan 1, 1978
126.391
-24.373
-16.17%
jan 1, 1979
165.732
+39.341
31.13%
jan 1, 1980
114.146
-51.586
-31.13%
jan 1, 1981
114.316
+0.17
0.15%
jan 1, 1982
141.348
+27.032
23.65%
jan 1, 1983
115.544
-25.804
-18.26%
jan 1, 1984
107.451
-8.093
-7.0%
jan 1, 1985
100.521
-6.93
-6.45%
jan 1, 1986
117.474
+16.953
16.87%
jan 1, 1987
126.998
+9.524
8.11%
jan 1, 1988
103.953
-23.045
-18.15%
jan 1, 1989
95.463
-8.49
-8.17%
jan 1, 1990
127.403
+31.94
33.46%
jan 1, 1991
116.709
-10.694
-8.39%
jan 1, 1992
104.48
-12.229
-10.48%
jan 1, 1993
93.269
-11.21
-10.73%
jan 1, 1994
153.229
+59.959
64.29%
jan 1, 1995
118.469
-34.759
-22.68%
jan 1, 1996
98.472
-19.998
-16.88%
jan 1, 1997
113.101
+14.629
14.86%
jan 1, 1998
96.354
-16.747
-14.81%
jan 1, 1999
64.909
-31.445
-32.63%
jan 1, 2000
84.588
+19.679
30.32%
jan 1, 2001
82.414
-2.174
-2.57%
jan 1, 2002
101.141
+18.726
22.72%
jan 1, 2003
126.077
+24.936
24.65%
jan 1, 2004
87.626
-38.451
-30.5%
jan 1, 2005
63.471
-24.155
-27.57%
jan 1, 2006
59.827
-3.643
-5.74%
jan 1, 2007
69.595
+9.768
16.33%
jan 1, 2008
104.327
+34.732
49.91%
jan 1, 2009
132.421
+28.094
26.93%
jan 1, 2010
106.647
-25.774
-19.46%
jan 1, 2011
103.149
-3.498
-3.28%
jan 1, 2012
103.358
+0.209
0.2%
jan 1, 2013
108.052
+4.694
4.54%
jan 1, 2014
75.772
-32.28
-29.87%
jan 1, 2015
64.777
-10.995
-14.51%
Ranking of countries by current statistics by years


Comments: