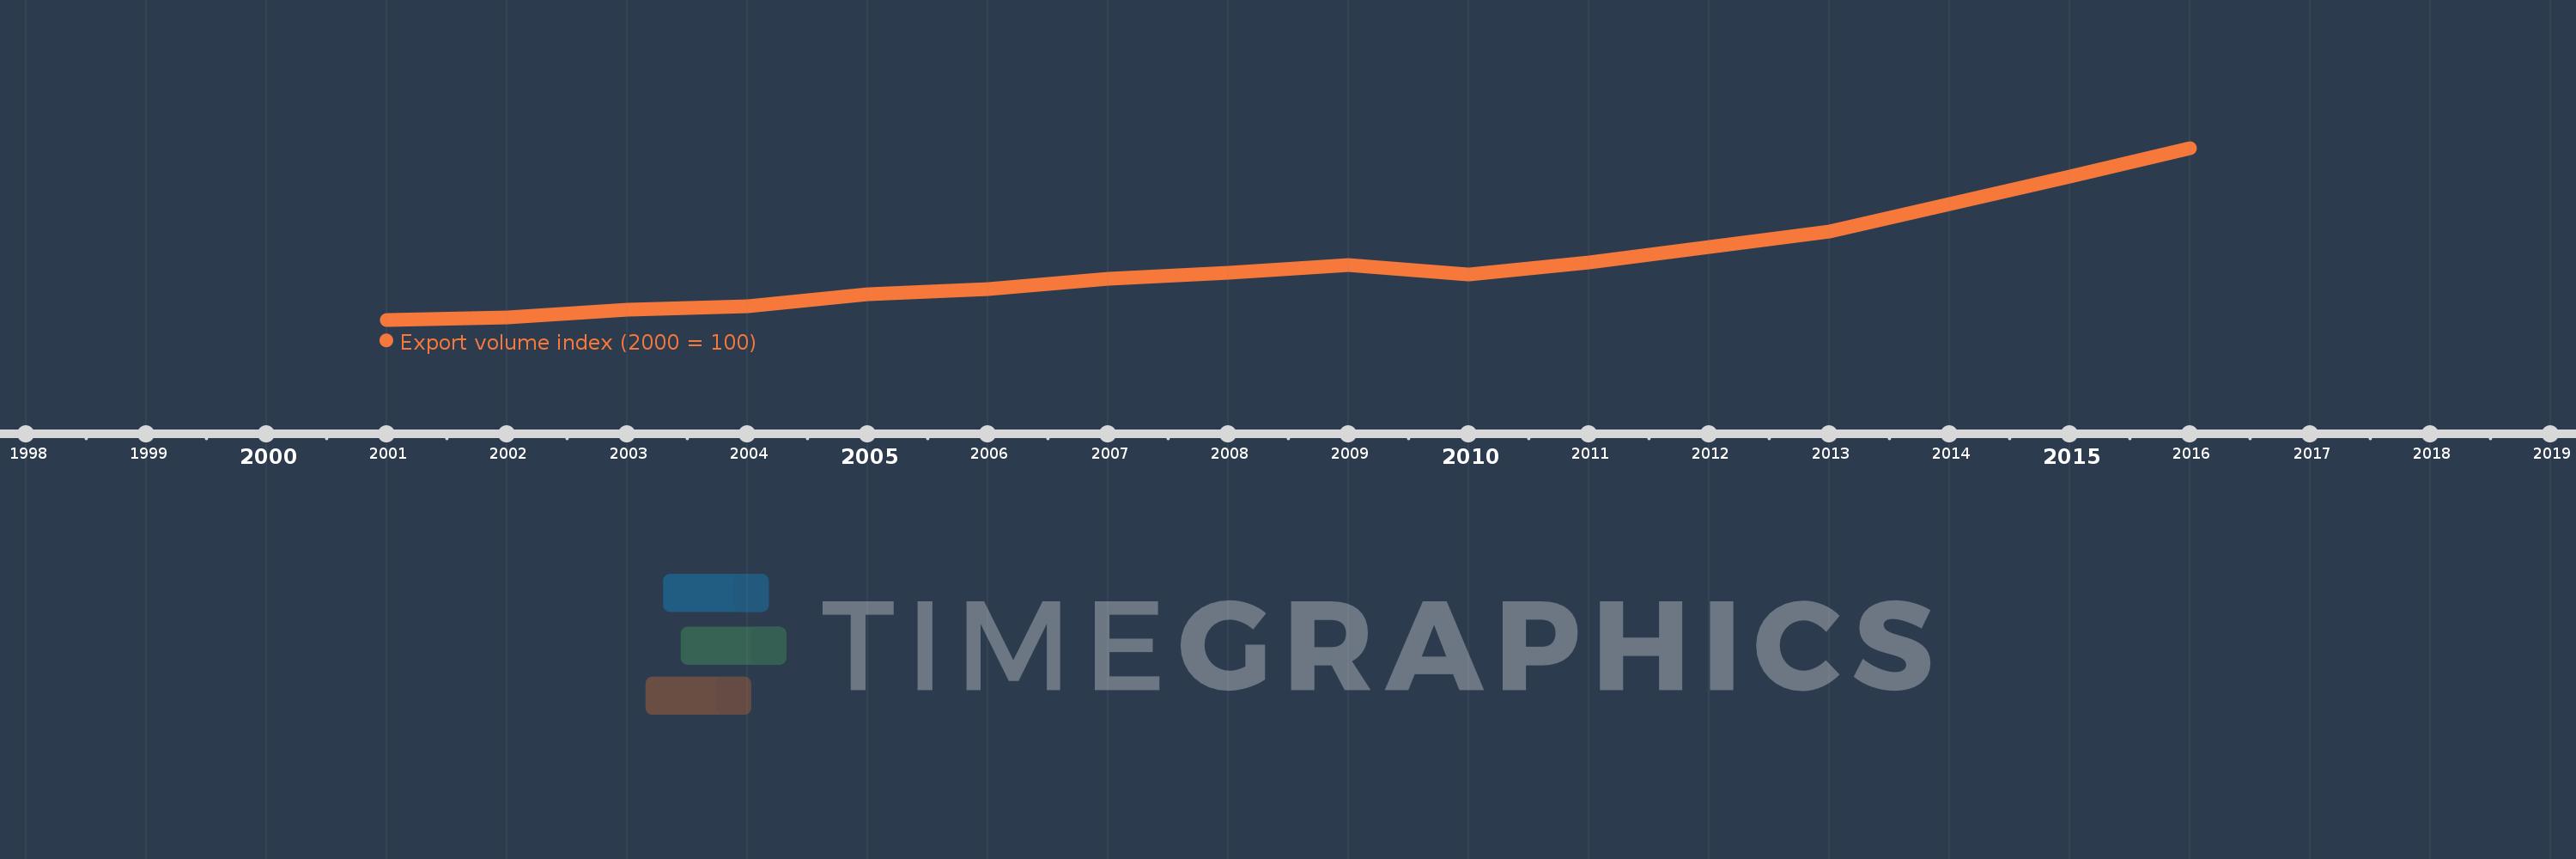
This timeline shows a graph from 2001 to 2016 of Cambodia. No data until 2000. Number of actual observations by date: 16.
Source name:
World Development Indicators
Source organization:
United Nations Conference on Trade and Development, Handbook of Statistics and data files, and International Monetary Fund, International Financial Statistics.
Categories, topics:
Private Sector, Trade
Last updated:
apr 23, 2017
Indicators value changes by year
Meaning:
320.671
Minimum:
100.0
jan 1, 2001
Maximum:
759.493
jan 1, 2016
At the date of observation
Value
Absolute change
Change from the previous value
jan 1, 2001
100.0
+100.0
0.0%
jan 1, 2002
109.8
+9.8
9.8%
jan 1, 2003
139.857
+30.057
27.37%
jan 1, 2004
152.676
+12.819
9.17%
jan 1, 2005
198.236
+45.56
29.84%
jan 1, 2006
218.044
+19.808
9.99%
jan 1, 2007
257.186
+39.142
17.95%
jan 1, 2008
281.009
+23.823
9.26%
jan 1, 2009
308.689
+27.68
9.85%
jan 1, 2010
273.754
-34.935
-11.32%
jan 1, 2011
318.33
+44.576
16.28%
jan 1, 2012
379.287
+60.957
19.15%
jan 1, 2013
439.927
+60.64
15.99%
jan 1, 2014
543.449
+103.522
23.53%
jan 1, 2015
651.005
+107.555
19.79%
jan 1, 2016
759.493
+108.488
16.66%
Ranking of countries by current statistics by years