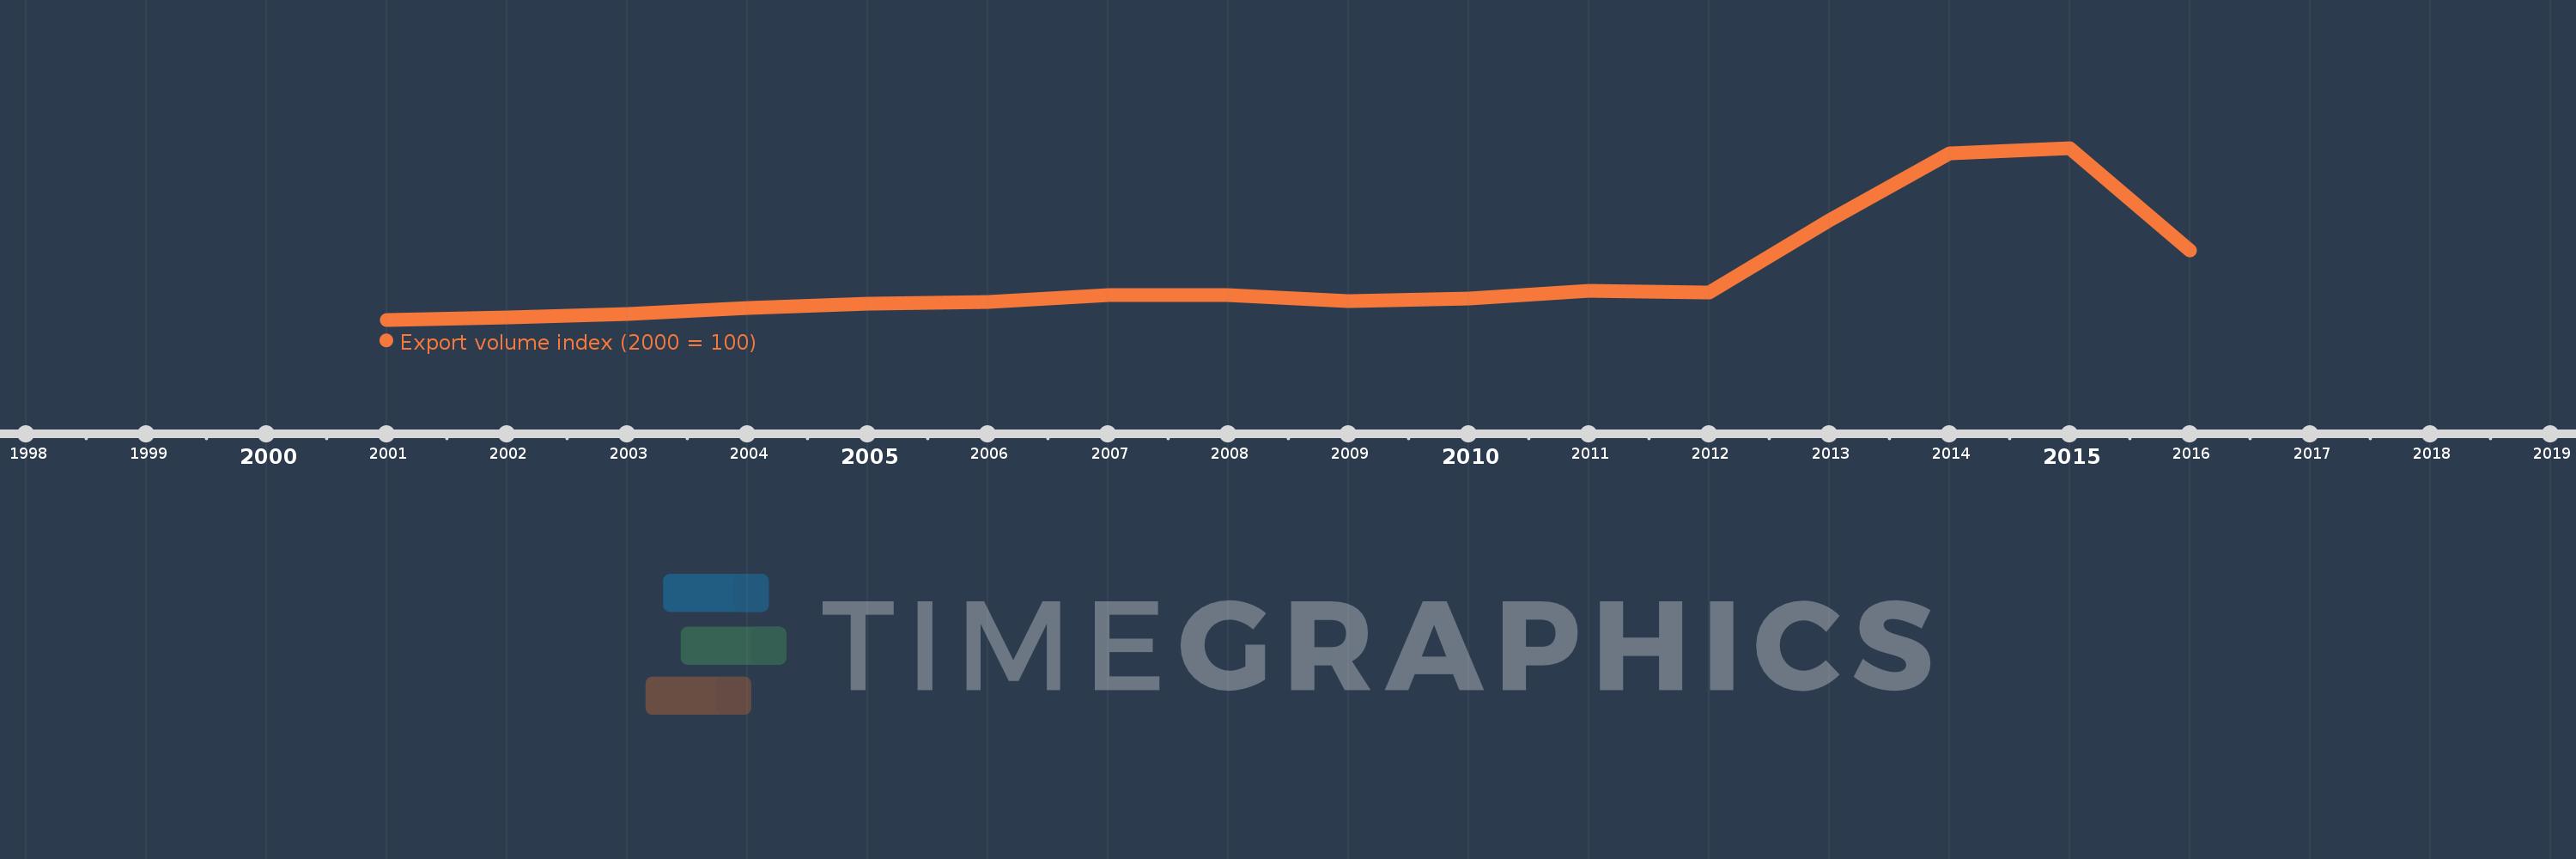
This timeline shows a graph from 2001 to 2016 of Sierra Leone. No data until 2000. Number of actual observations by date: 16.
Source name:
World Development Indicators
Source organization:
United Nations Conference on Trade and Development, Handbook of Statistics and data files, and International Monetary Fund, International Financial Statistics.
Categories, topics:
Private Sector, Trade
Last updated:
apr 23, 2017
Indicators value changes by year
Meaning:
2.586K
Minimum:
100.0
jan 1, 2001
Maximum:
9.778K
jan 1, 2015
At the date of observation
Value
Absolute change
Change from the previous value
jan 1, 2001
100.0
+100.0
0.0%
jan 1, 2002
247.21
+147.21
147.21%
jan 1, 2003
408.311
+161.101
65.17%
jan 1, 2004
739.337
+331.026
81.07%
jan 1, 2005
1.007K
+267.189
36.14%
jan 1, 2006
1.109K
+101.986
10.13%
jan 1, 2007
1.506K
+397.108
35.82%
jan 1, 2008
1.508K
+2.344
0.16%
jan 1, 2009
1.138K
-369.949
-24.53%
jan 1, 2010
1.29K
+151.518
13.31%
jan 1, 2011
1.725K
+435.953
33.81%
jan 1, 2012
1.652K
-73.511
-4.26%
jan 1, 2013
5.689K
+4.037K
244.39%
jan 1, 2014
9.468K
+3.779K
66.43%
jan 1, 2015
9.778K
+309.529
3.27%
jan 1, 2016
4.009K
-5.769K
-59.0%
Ranking of countries by current statistics by years