33
/
AIzaSyAYiBZKx7MnpbEhh9jyipgxe19OcubqV5w
August 1, 2025
128227
Eritrea
ERI
true
2
1
Export volume index (2000 = 100)
2016,2015,2014,2013,2012,2011,2010,2009,2008,2007,2006,2005,2004,2003,2002,2001,2000,1999,1998,1997,1996,1995,1994
Download
Global statistics library →Eritrea →

Export volume index (2000 = 100)

This statistics in other country:

AfghanistanAlbaniaAlgeriaAmerican SamoaAndorraAngolaAntigua and BarbudaArgentinaArmeniaArubaAustraliaAustriaAzerbaijanBahamas, TheBahrainBangladeshBarbadosBelarusBelgiumBelizeBeninBermudaBhutanBoliviaBosnia and HerzegovinaBotswanaBrazilBritish Virgin IslandsBrunei DarussalamBulgariaBurkina FasoBurundiCabo VerdeCambodiaCameroonCanadaCayman IslandsCentral African RepublicChadChileChinaColombiaComorosCongo, Dem. Rep.Congo, Rep.Costa RicaCote d'IvoireCroatiaCubaCuracaoCyprusCzech RepublicDenmarkDjiboutiDominicaDominican RepublicEcuadorEgypt, Arab Rep.El SalvadorEquatorial GuineaEritreaEstoniaEthiopiaFaroe IslandsFijiFinlandFranceFrench PolynesiaGabonGambia, TheGeorgiaGermanyGhanaGibraltarGreeceGreenlandGrenadaGuamGuatemalaGuineaGuinea-BissauGuyanaHaitiHondurasHong Kong SAR, ChinaHungaryIcelandIndiaIndonesiaIran, Islamic Rep.IraqIrelandIsraelItalyJamaicaJapanJordanKazakhstanKenyaKiribatiKorea, Dem. People’s Rep.Korea, Rep.KuwaitKyrgyz RepublicLao PDRLatviaLebanonLesothoLiberiaLibyaLithuaniaLuxembourgMacao SAR, ChinaMacedonia, FYRMadagascarMalawiMalaysiaMaldivesMaliMaltaMarshall IslandsMauritaniaMauritiusMexicoMicronesia, Fed. Sts.MoldovaMongoliaMoroccoMozambiqueMyanmarNamibiaNauruNepalNetherlandsNew CaledoniaNew ZealandNicaraguaNigerNigeriaNorthern Mariana IslandsNorwayOmanPakistanPalauPanamaPapua New GuineaParaguayPeruPhilippinesPolandPortugalQatarRomaniaRussian FederationRwandaSamoaSao Tome and PrincipeSaudi ArabiaSenegalSerbiaSeychellesSierra LeoneSingaporeSlovak RepublicSloveniaSolomon IslandsSomaliaSouth AfricaSpainSri LankaSt. Kitts and NevisSt. LuciaSt. Vincent and the GrenadinesSudanSurinameSwazilandSwedenSwitzerlandSyrian Arab RepublicTajikistanTanzaniaThailandTogoTongaTrinidad and TobagoTunisiaTurkeyTurkmenistanTurks and Caicos IslandsUgandaUkraineUnited Arab EmiratesUnited KingdomUnited StatesUruguayUzbekistanVanuatuVenezuela, RBVietnamWest Bank and GazaYemen, Rep.ZambiaZimbabwe

Timeline:

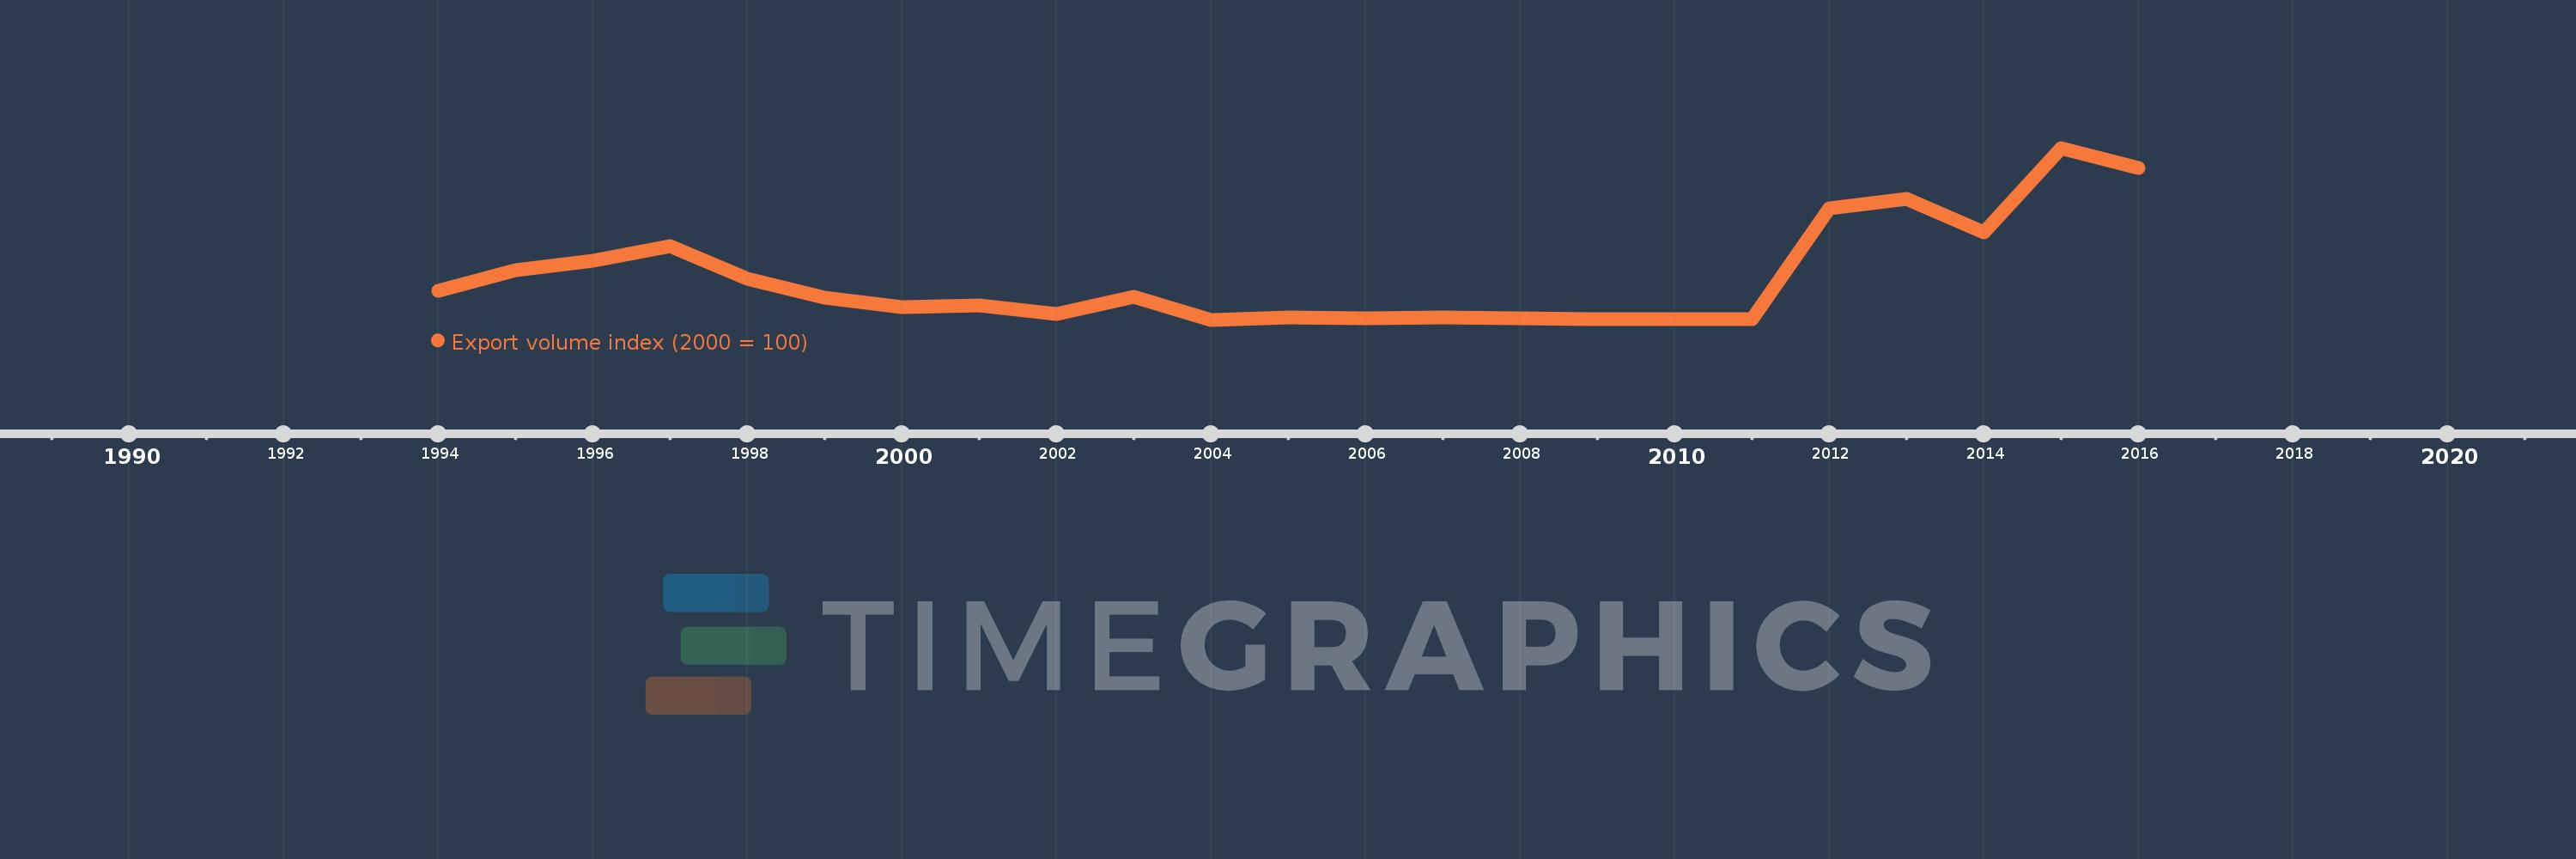
This timeline shows a graph from 1994 to 2016 of Eritrea. No data until 1993. Number of actual observations by date: 23.

Source name:

World Development Indicators

Source organization:

United Nations Conference on Trade and Development, Handbook of Statistics and data files, and International Monetary Fund, International Financial Statistics.

Categories, topics:

Private Sector, Trade

Last updated:

apr 23, 2017

Indicators value changes by year

Meaning:
264.957
Minimum:
18.8
jan 1, 2004
Maximum:
1.008K
jan 1, 2015
At the date of observation
Value
Absolute change
Change from the previous value
jan 1, 1994
184.504
+184.504
0.0%
jan 1, 1995
306.108
+121.604
65.91%
jan 1, 1996
359.99
+53.883
17.6%
jan 1, 1997
440.509
+80.519
22.37%
jan 1, 1998
253.822
-186.687
-42.38%
jan 1, 1999
146.983
-106.838
-42.09%
jan 1, 2000
92.683
-54.3
-36.94%
jan 1, 2001
100.0
+7.317
7.89%
jan 1, 2002
50.554
-49.446
-49.45%
jan 1, 2003
152.457
+101.903
201.57%
jan 1, 2004
18.8
-133.657
-87.67%
jan 1, 2005
30.236
+11.436
60.83%
jan 1, 2006
29.66
-0.576
-1.91%
jan 1, 2007
30.082
+0.422
1.42%
jan 1, 2008
28.095
-1.987
-6.6%
jan 1, 2009
22.07
-6.024
-21.44%
jan 1, 2010
22.458
+0.387
1.75%
jan 1, 2011
23.076
+0.619
2.76%
jan 1, 2012
661.381
+638.305
2.77K%
jan 1, 2013
716.817
+55.436
8.38%
jan 1, 2014
521.077
-195.74
-27.31%
jan 1, 2015
1.008K
+486.833
93.43%
jan 1, 2016
894.74
-113.17
-11.23%

Ranking of countries by current statistics by years