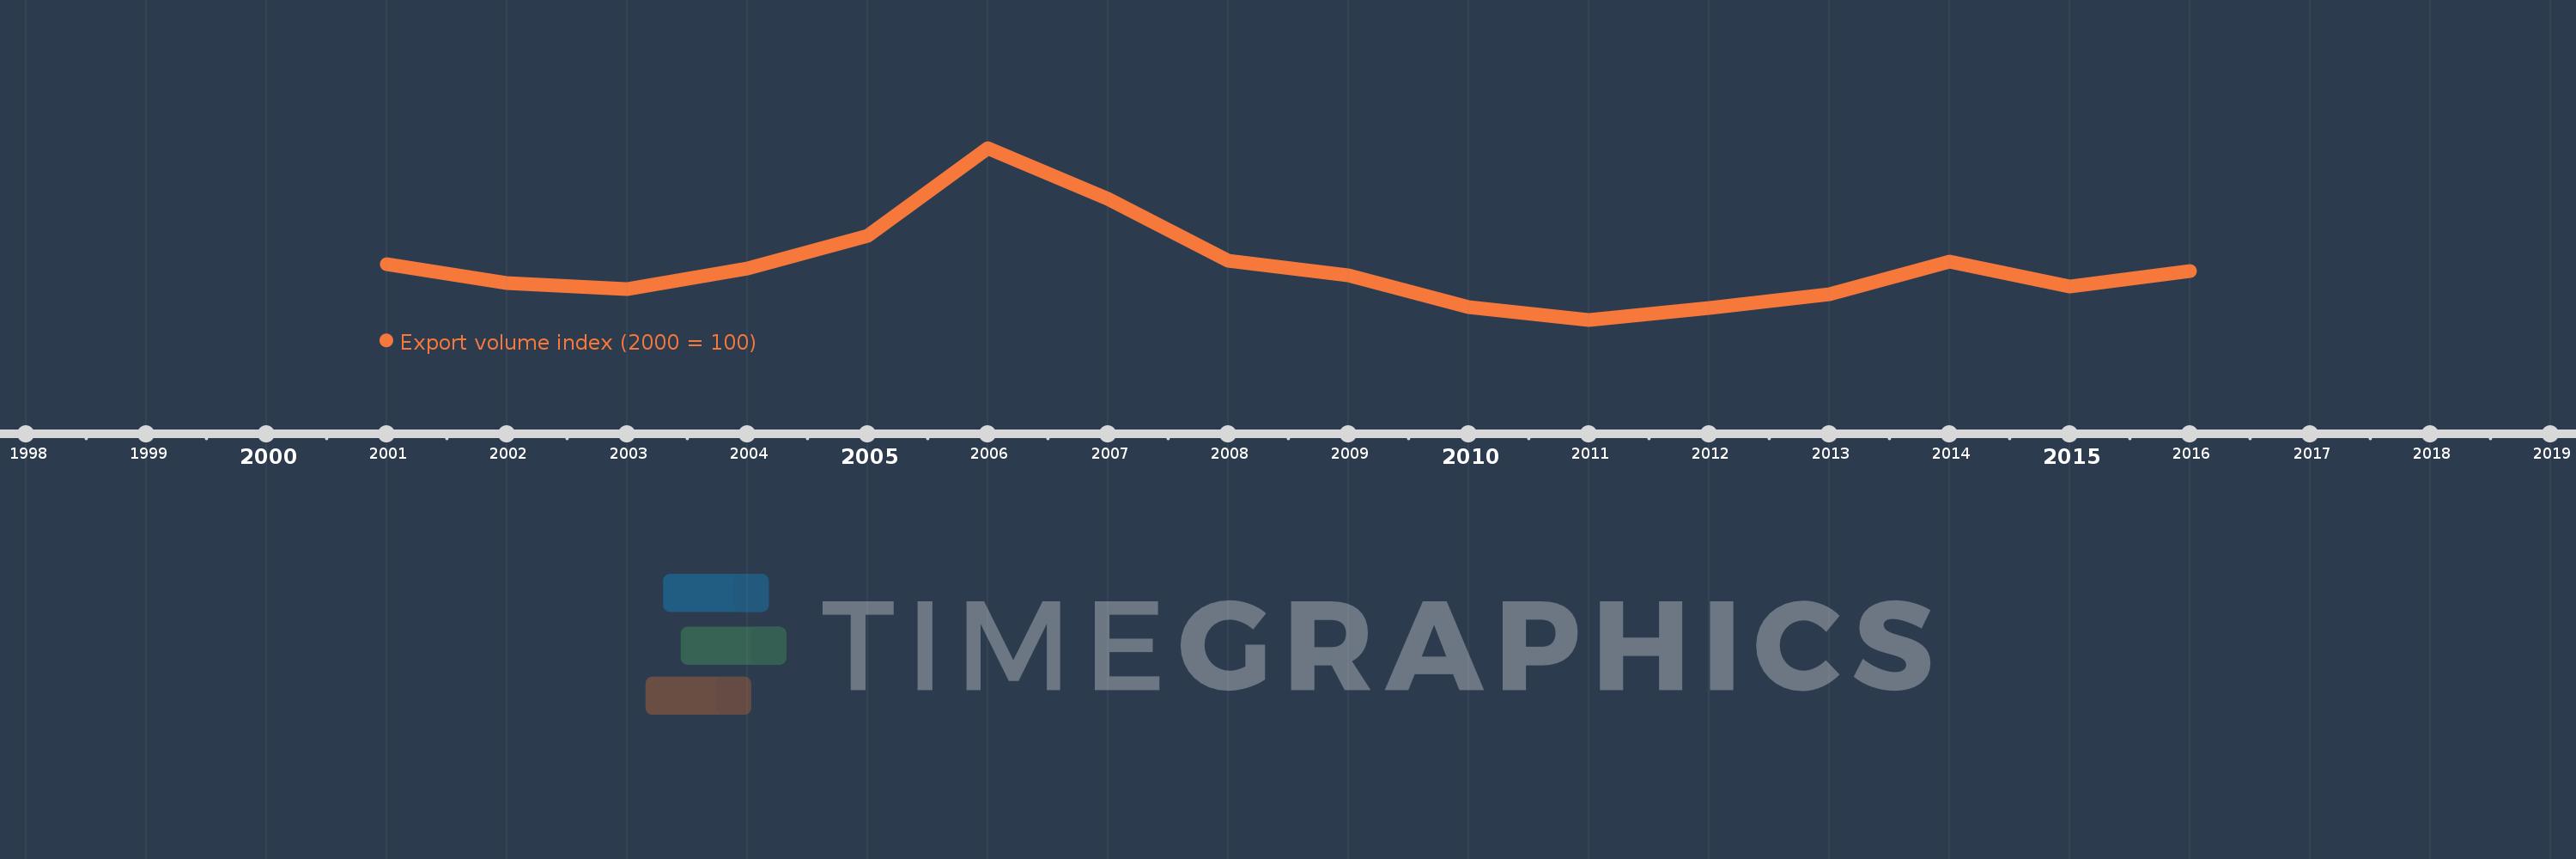
This timeline shows a graph from 2001 to 2016 of Antigua and Barbuda. No data until 2000. Number of actual observations by date: 16.
Source name:
World Development Indicators
Source organization:
United Nations Conference on Trade and Development, Handbook of Statistics and data files, and International Monetary Fund, International Financial Statistics.
Categories, topics:
Private Sector, Trade
Last updated:
apr 23, 2017
Indicators value changes by year
Meaning:
98.23
Minimum:
63.046
jan 1, 2011
Maximum:
177.603
jan 1, 2006
At the date of observation
Value
Absolute change
Change from the previous value
jan 1, 2001
100.0
+100.0
0.0%
jan 1, 2002
87.359
-12.641
-12.64%
jan 1, 2003
83.682
-3.677
-4.21%
jan 1, 2004
97.02
+13.338
15.94%
jan 1, 2005
119.289
+22.269
22.95%
jan 1, 2006
177.603
+58.315
48.89%
jan 1, 2007
143.605
-33.998
-19.14%
jan 1, 2008
102.649
-40.957
-28.52%
jan 1, 2009
92.461
-10.187
-9.92%
jan 1, 2010
71.227
-21.234
-22.97%
jan 1, 2011
63.046
-8.182
-11.49%
jan 1, 2012
71.055
+8.009
12.7%
jan 1, 2013
80.295
+9.24
13.0%
jan 1, 2014
101.848
+21.553
26.84%
jan 1, 2015
85.104
-16.743
-16.44%
jan 1, 2016
95.442
+10.338
12.15%
Ranking of countries by current statistics by years