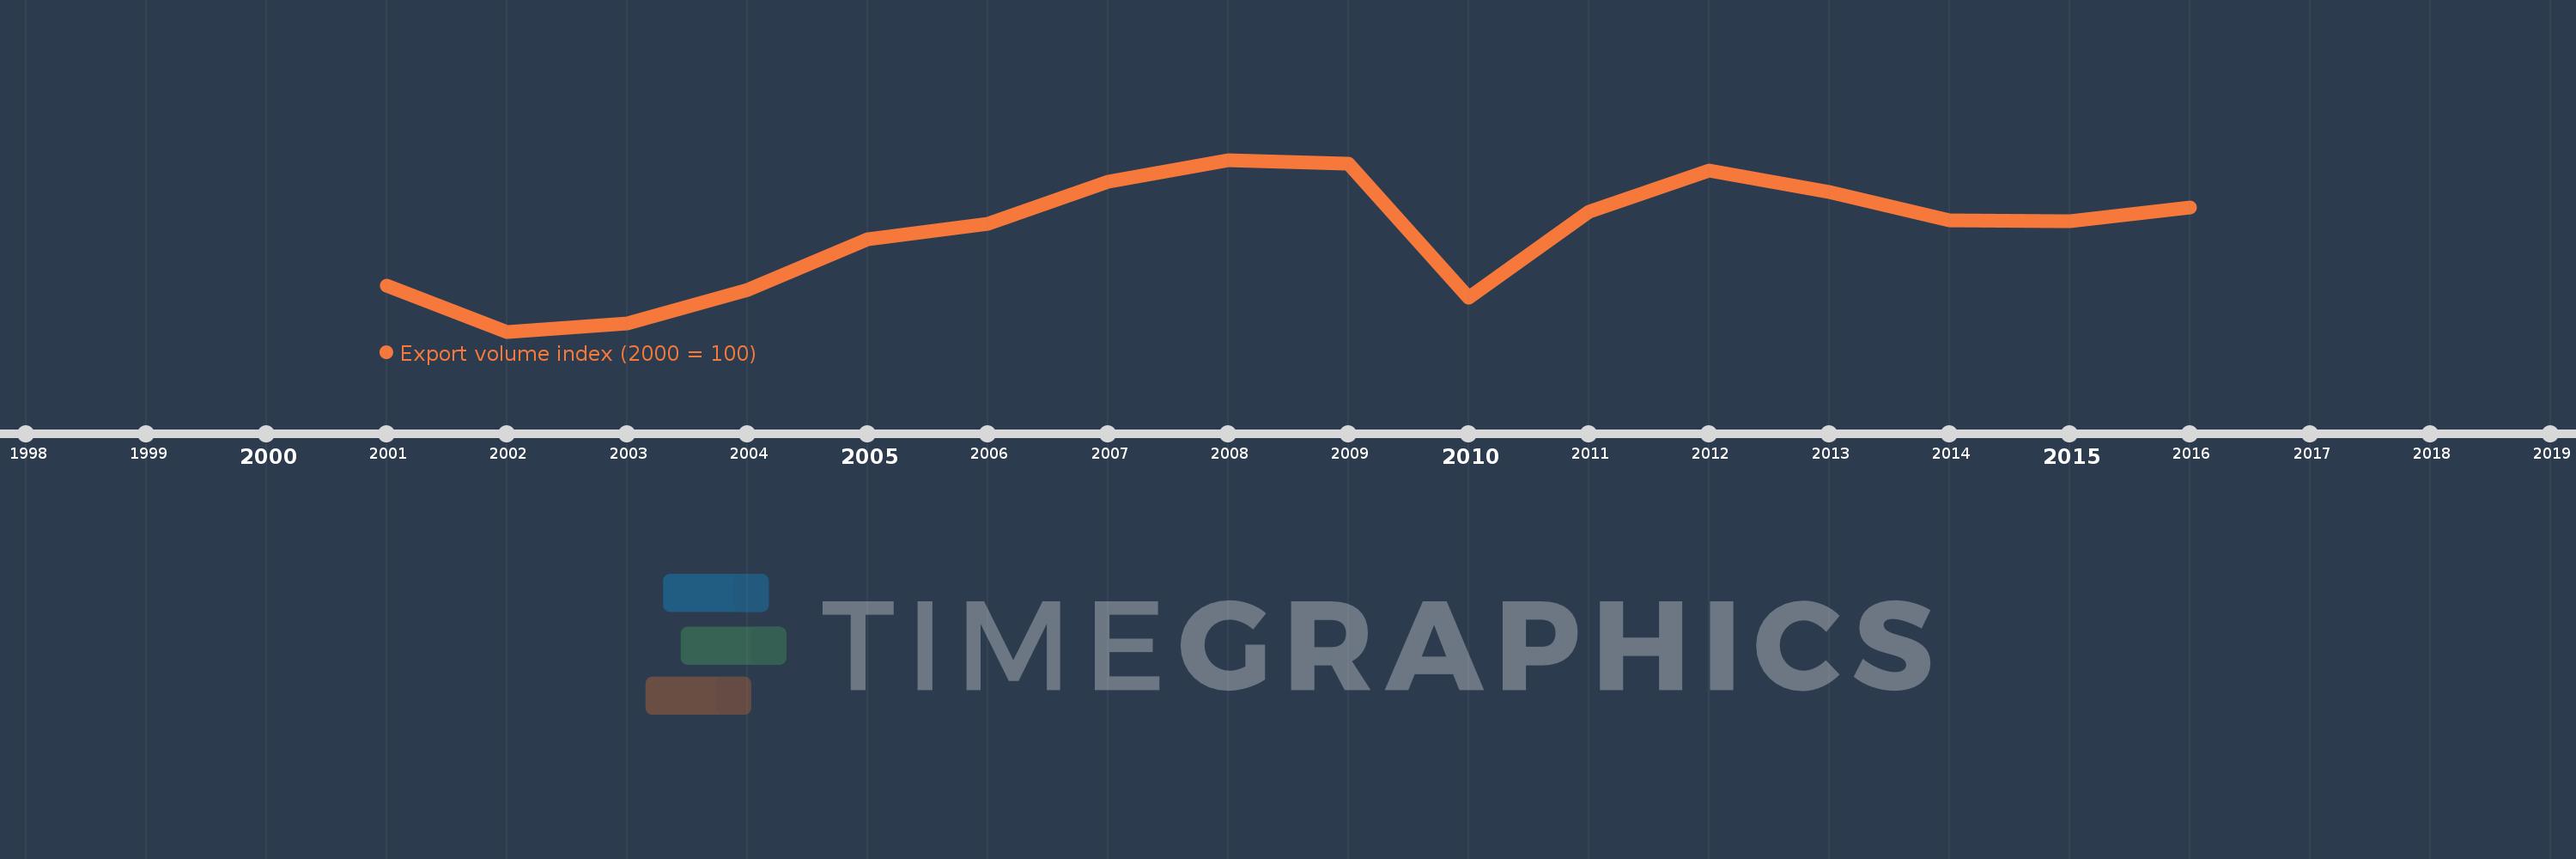
This timeline shows a graph from 2001 to 2016 of Sweden. No data until 2000. Number of actual observations by date: 16.
Source name:
World Development Indicators
Source organization:
United Nations Conference on Trade and Development, Handbook of Statistics and data files, and International Monetary Fund, International Financial Statistics.
Categories, topics:
Private Sector, Trade
Last updated:
apr 23, 2017
Indicators value changes by year
Meaning:
109.554
Minimum:
91.869
jan 1, 2002
Maximum:
122.513
jan 1, 2008
At the date of observation
Value
Absolute change
Change from the previous value
jan 1, 2001
100.0
+100.0
0.0%
jan 1, 2002
91.869
-8.131
-8.13%
jan 1, 2003
93.254
+1.385
1.51%
jan 1, 2004
99.229
+5.975
6.41%
jan 1, 2005
108.386
+9.157
9.23%
jan 1, 2006
111.129
+2.743
2.53%
jan 1, 2007
118.636
+7.506
6.75%
jan 1, 2008
122.513
+3.877
3.27%
jan 1, 2009
121.879
-0.633
-0.52%
jan 1, 2010
97.925
-23.954
-19.65%
jan 1, 2011
113.316
+15.391
15.72%
jan 1, 2012
120.671
+7.354
6.49%
jan 1, 2013
116.699
-3.972
-3.29%
jan 1, 2014
111.74
-4.959
-4.25%
jan 1, 2015
111.576
-0.164
-0.15%
jan 1, 2016
114.034
+2.458
2.2%
Ranking of countries by current statistics by years