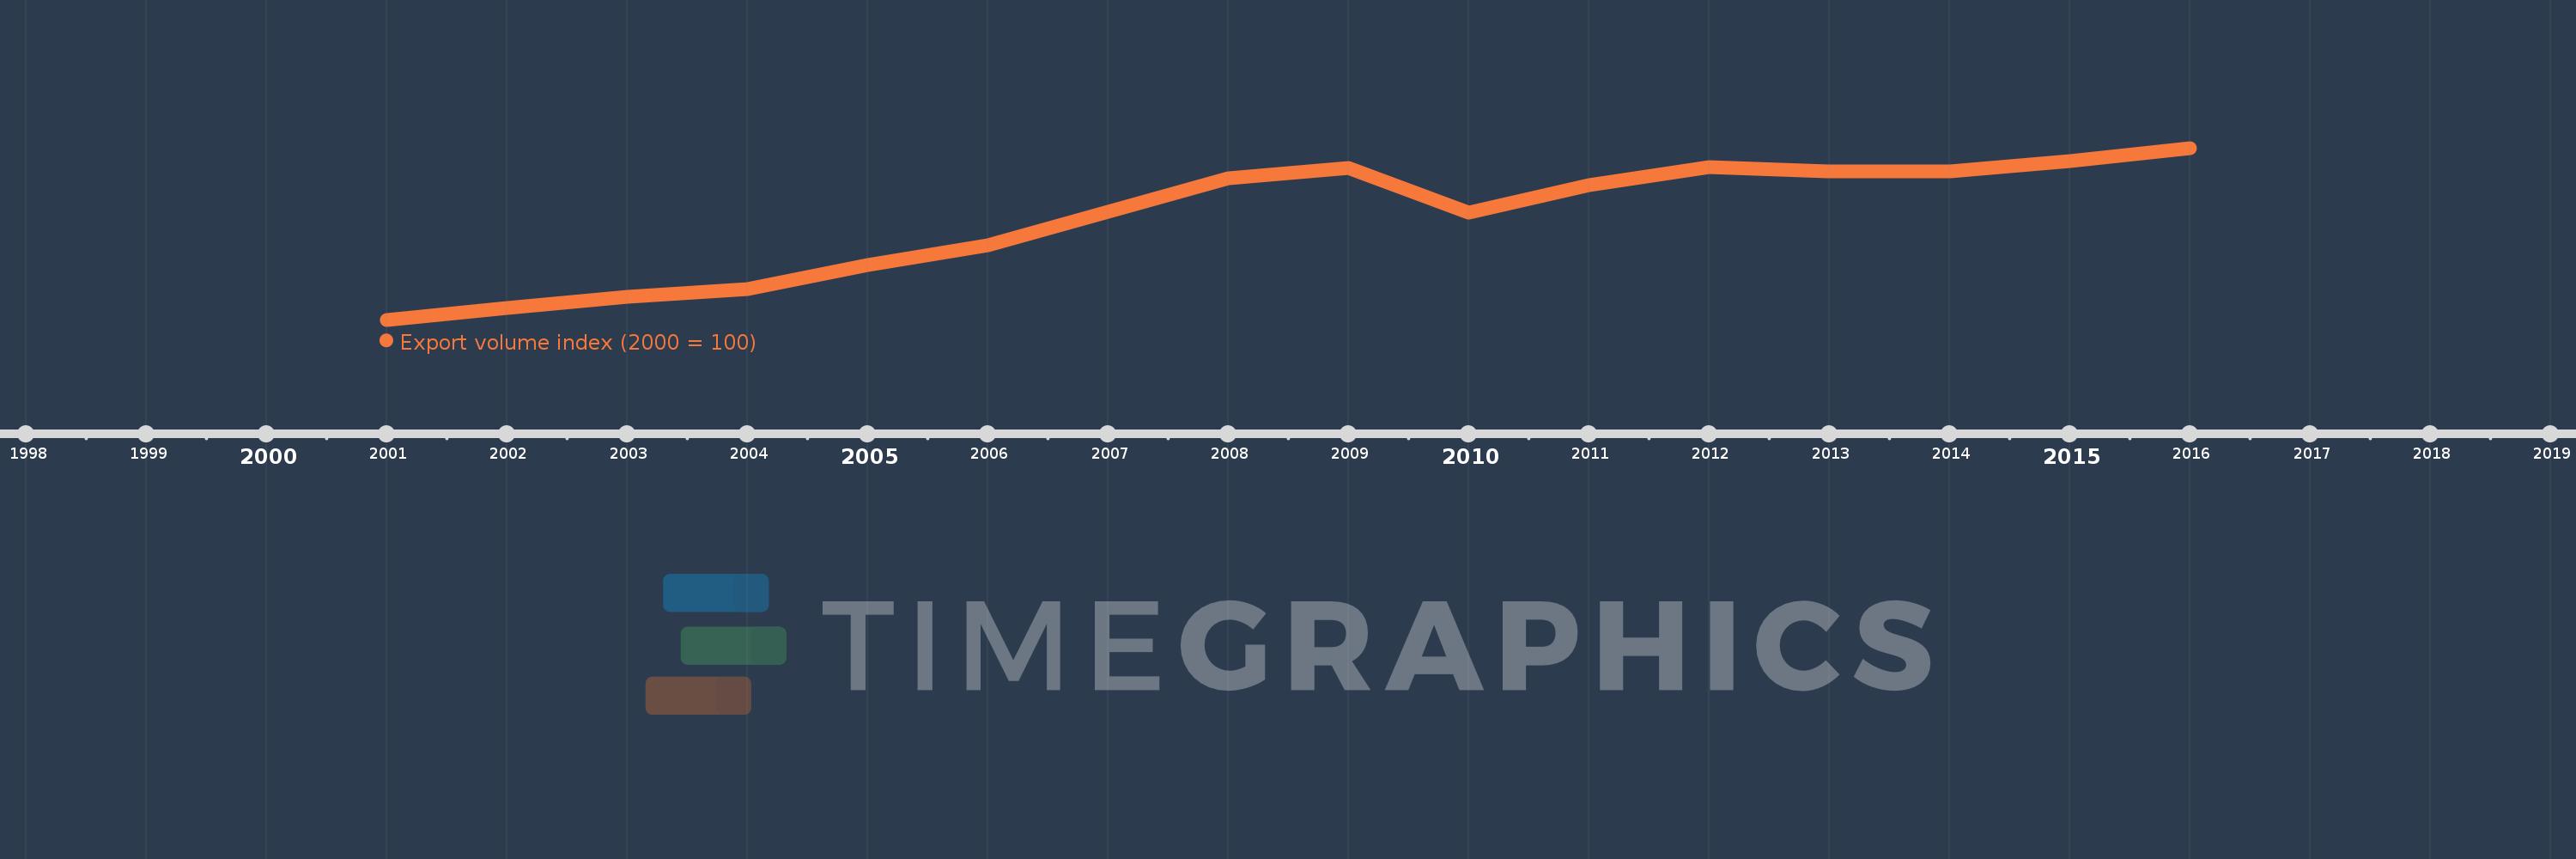
This timeline shows a graph from 2001 to 2016 of Hungary. No data until 2000. Number of actual observations by date: 16.
Source name:
World Development Indicators
Source organization:
United Nations Conference on Trade and Development, Handbook of Statistics and data files, and International Monetary Fund, International Financial Statistics.
Categories, topics:
Private Sector, Trade
Last updated:
apr 23, 2017
Indicators value changes by year
Meaning:
194.204
Minimum:
100.0
jan 1, 2001
Maximum:
260.28
jan 1, 2016
At the date of observation
Value
Absolute change
Change from the previous value
jan 1, 2001
100.0
+100.0
0.0%
jan 1, 2002
110.918
+10.918
10.92%
jan 1, 2003
121.766
+10.847
9.78%
jan 1, 2004
128.541
+6.776
5.56%
jan 1, 2005
150.654
+22.113
17.2%
jan 1, 2006
169.097
+18.443
12.24%
jan 1, 2007
200.87
+31.773
18.79%
jan 1, 2008
231.659
+30.789
15.33%
jan 1, 2009
241.563
+9.904
4.28%
jan 1, 2010
200.293
-41.27
-17.08%
jan 1, 2011
225.469
+25.176
12.57%
jan 1, 2012
242.023
+16.555
7.34%
jan 1, 2013
238.051
-3.972
-1.64%
jan 1, 2014
238.212
+0.161
0.07%
jan 1, 2015
247.867
+9.655
4.05%
jan 1, 2016
260.28
+12.412
5.01%
Ranking of countries by current statistics by years