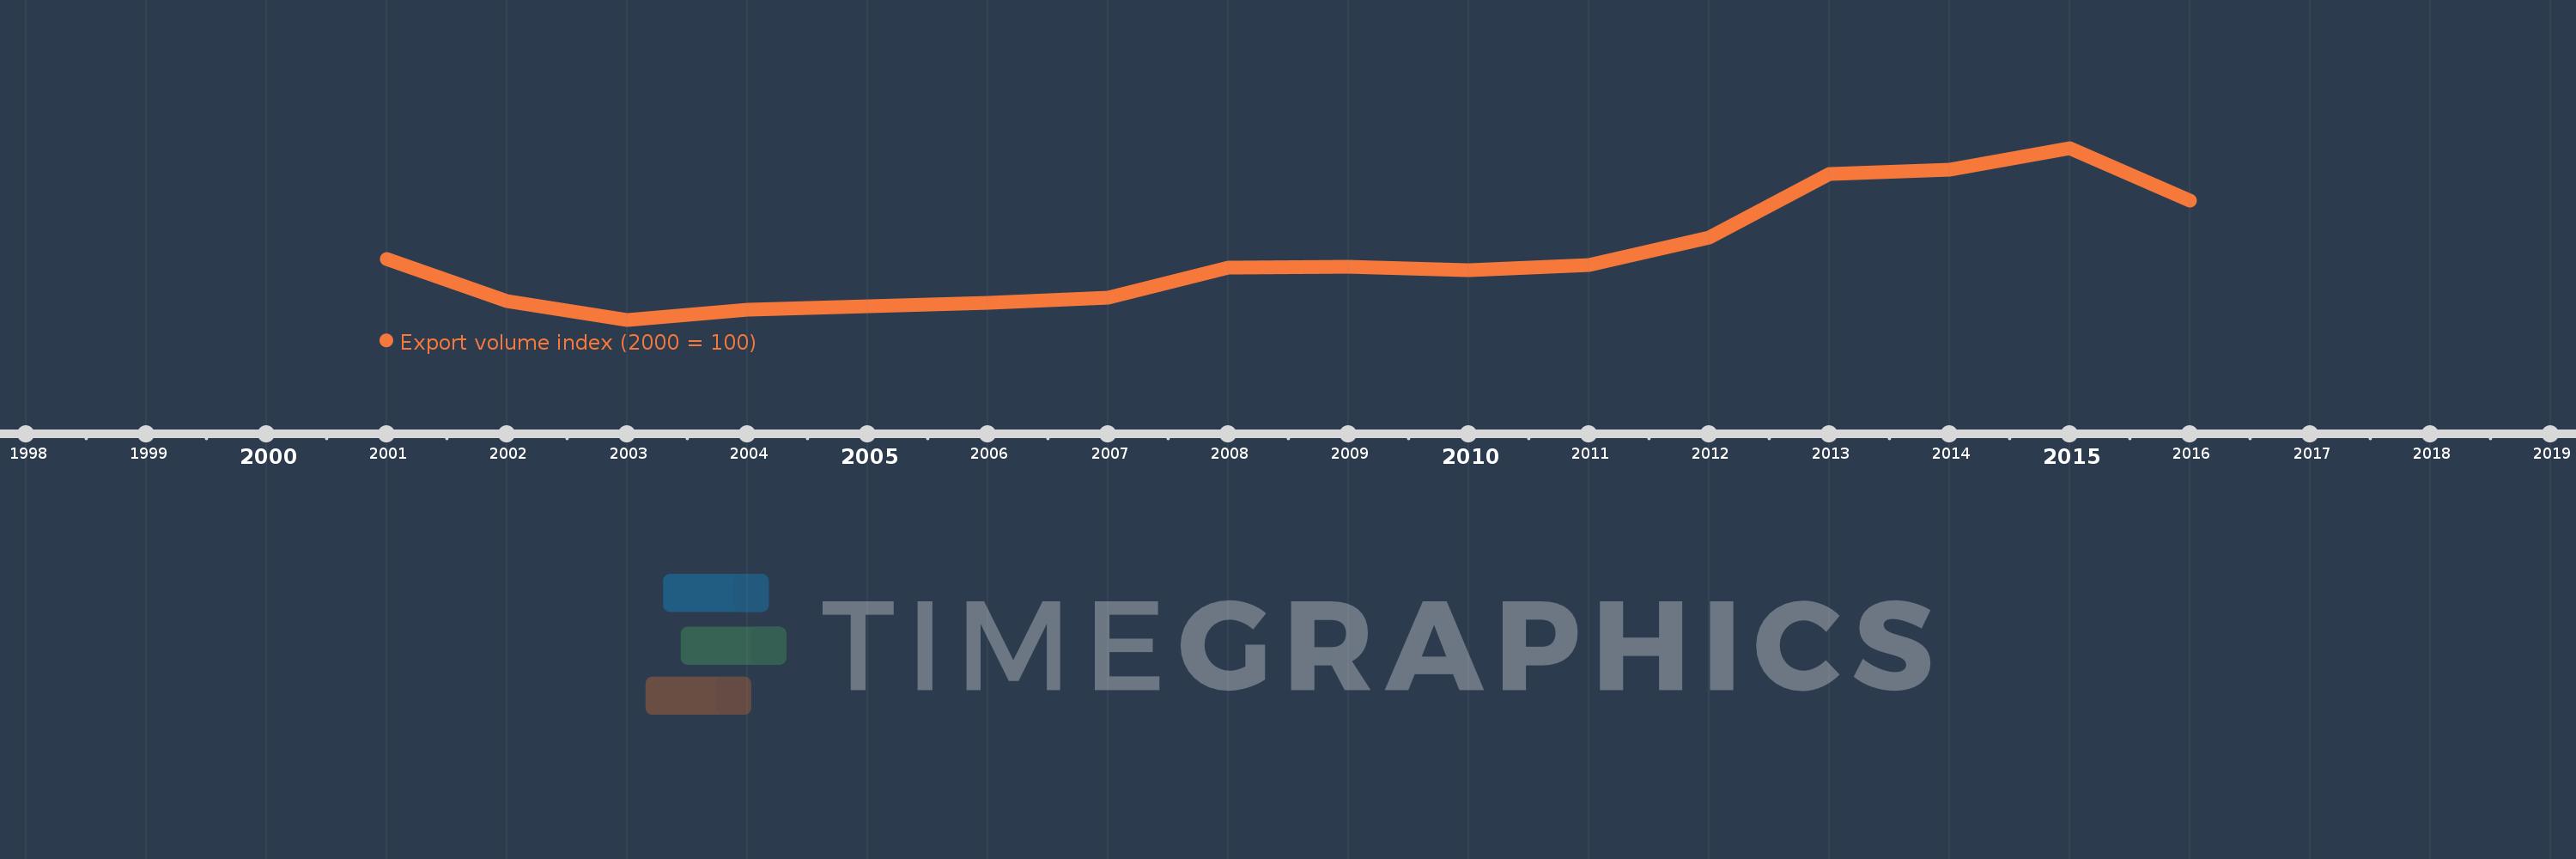
This timeline shows a graph from 2001 to 2016 of West Bank and Gaza. No data until 2000. Number of actual observations by date: 16.
Source name:
World Development Indicators
Source organization:
United Nations Conference on Trade and Development, Handbook of Statistics and data files, and International Monetary Fund, International Financial Statistics.
Categories, topics:
Private Sector, Trade
Last updated:
apr 23, 2017
Indicators value changes by year
Meaning:
101.754
Minimum:
60.555
jan 1, 2003
Maximum:
171.569
jan 1, 2015
At the date of observation
Value
Absolute change
Change from the previous value
jan 1, 2001
100.0
+100.0
0.0%
jan 1, 2002
72.624
-27.376
-27.38%
jan 1, 2003
60.555
-12.069
-16.62%
jan 1, 2004
67.146
+6.59
10.88%
jan 1, 2005
69.218
+2.073
3.09%
jan 1, 2006
71.69
+2.471
3.57%
jan 1, 2007
74.939
+3.25
4.53%
jan 1, 2008
94.316
+19.377
25.86%
jan 1, 2009
94.972
+0.655
0.7%
jan 1, 2010
92.365
-2.607
-2.74%
jan 1, 2011
95.997
+3.632
3.93%
jan 1, 2012
113.406
+17.409
18.13%
jan 1, 2013
154.477
+41.071
36.22%
jan 1, 2014
157.27
+2.793
1.81%
jan 1, 2015
171.569
+14.299
9.09%
jan 1, 2016
137.515
-34.054
-19.85%
Ranking of countries by current statistics by years