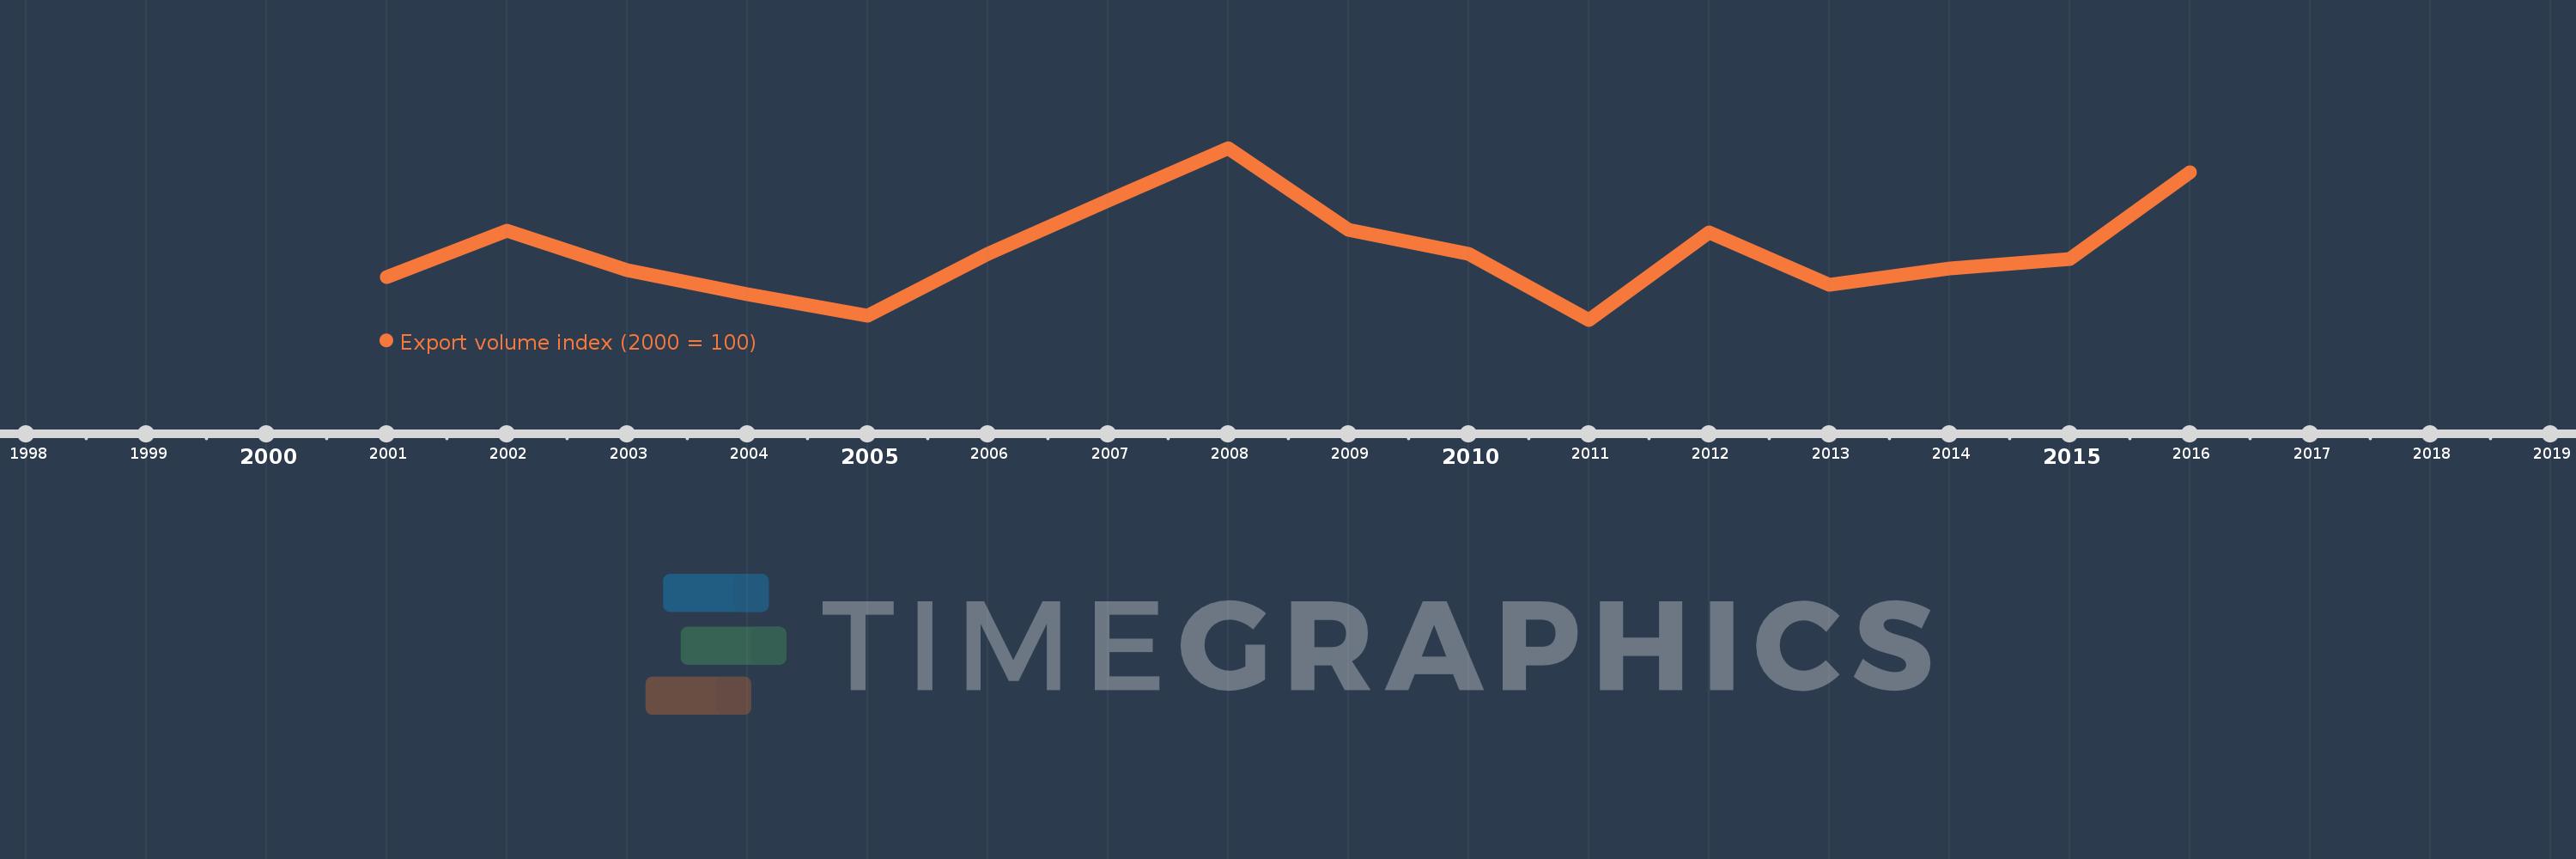
This timeline shows a graph from 2001 to 2016 of Kiribati. No data until 2000. Number of actual observations by date: 16.
Source name:
World Development Indicators
Source organization:
United Nations Conference on Trade and Development, Handbook of Statistics and data files, and International Monetary Fund, International Financial Statistics.
Categories, topics:
Private Sector, Trade
Last updated:
apr 23, 2017
Indicators value changes by year
Meaning:
120.493
Minimum:
66.723
jan 1, 2011
Maximum:
200.674
jan 1, 2008
At the date of observation
Value
Absolute change
Change from the previous value
jan 1, 2001
100.0
+100.0
0.0%
jan 1, 2002
136.059
+36.059
36.06%
jan 1, 2003
105.685
-30.374
-22.32%
jan 1, 2004
86.884
-18.801
-17.79%
jan 1, 2005
69.609
-17.275
-19.88%
jan 1, 2006
117.788
+48.179
69.21%
jan 1, 2007
159.739
+41.951
35.62%
jan 1, 2008
200.674
+40.935
25.63%
jan 1, 2009
136.52
-64.154
-31.97%
jan 1, 2010
117.764
-18.756
-13.74%
jan 1, 2011
66.723
-51.041
-43.34%
jan 1, 2012
134.511
+67.788
101.6%
jan 1, 2013
93.903
-40.608
-30.19%
jan 1, 2014
106.407
+12.504
13.32%
jan 1, 2015
113.954
+7.546
7.09%
jan 1, 2016
181.661
+67.707
59.42%
Ranking of countries by current statistics by years