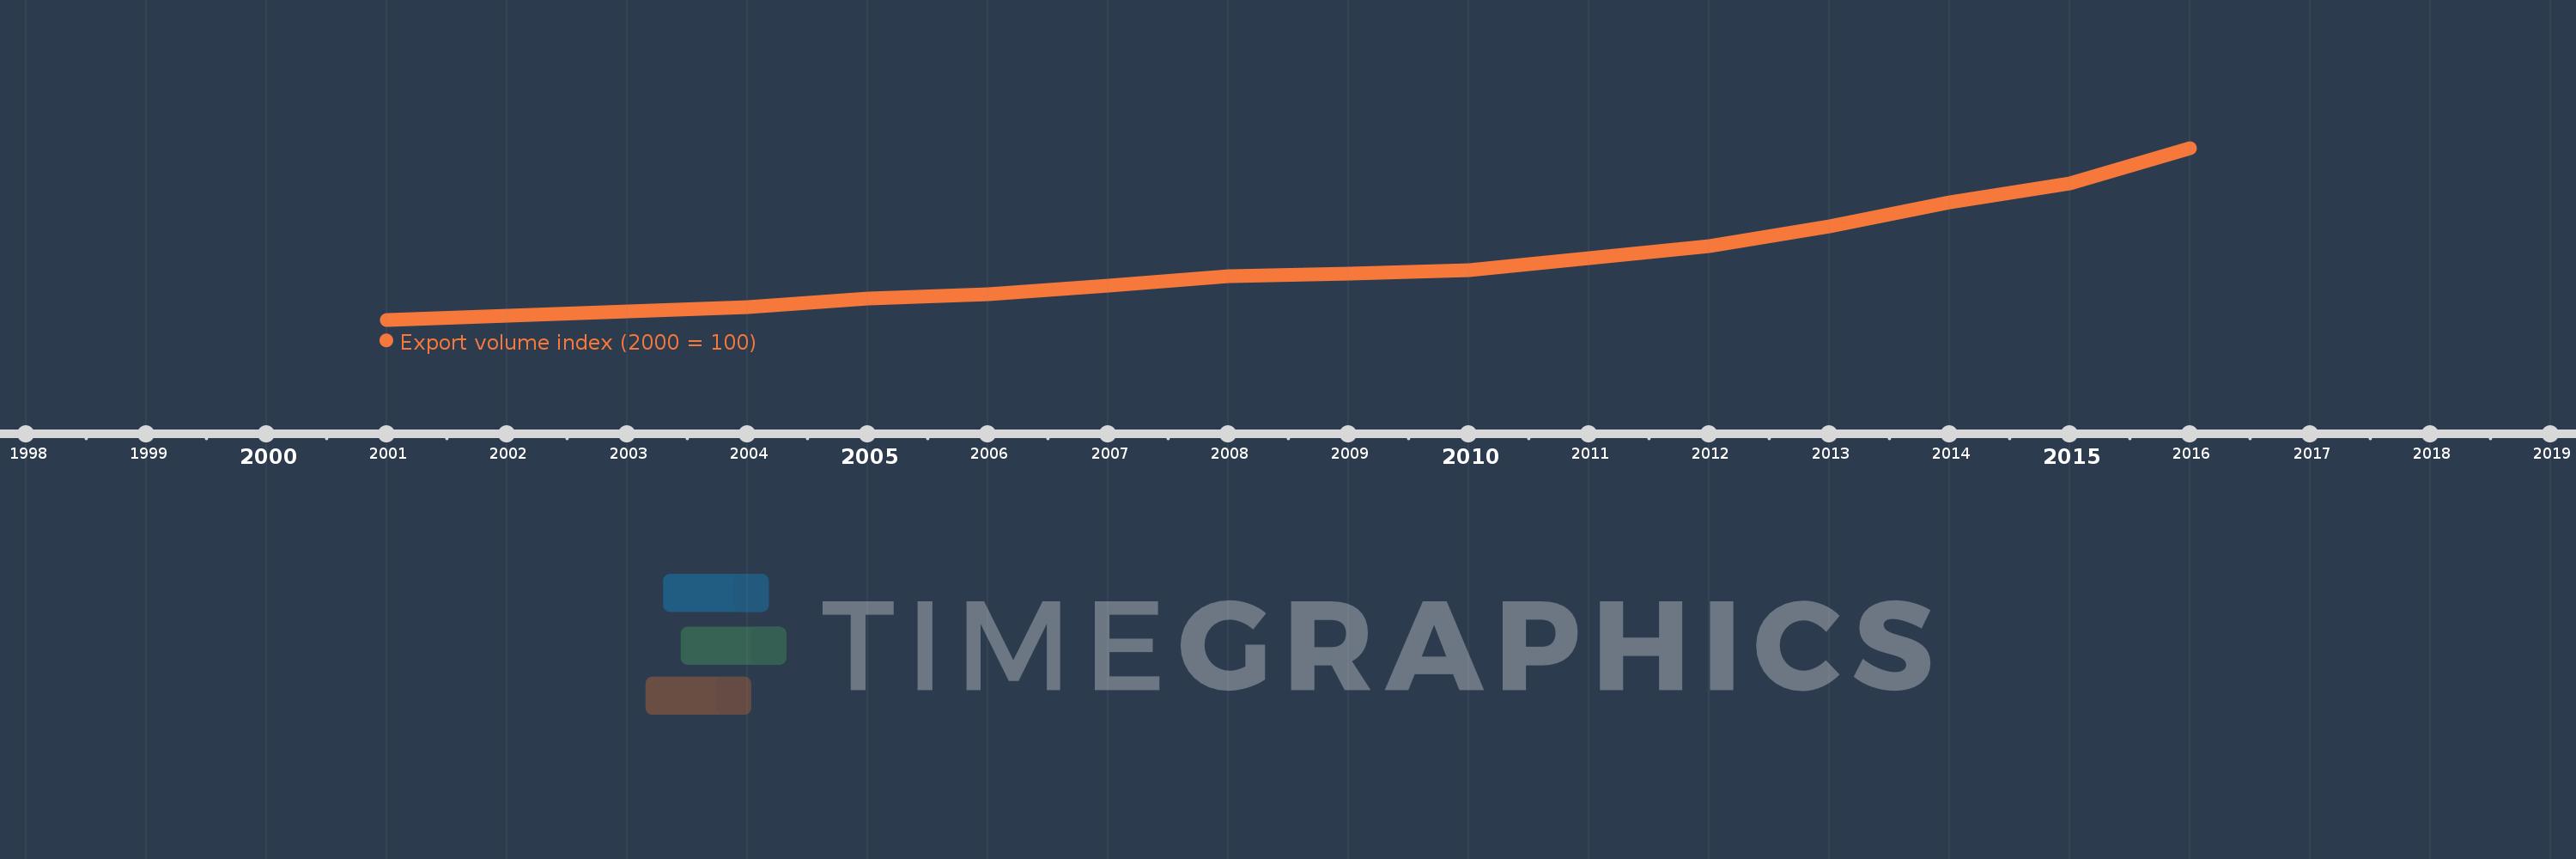
This timeline shows a graph from 2001 to 2016 of Vietnam. No data until 2000. Number of actual observations by date: 16.
Source name:
World Development Indicators
Source organization:
United Nations Conference on Trade and Development, Handbook of Statistics and data files, and International Monetary Fund, International Financial Statistics.
Categories, topics:
Private Sector, Trade
Last updated:
apr 23, 2017
Indicators value changes by year
Meaning:
256.188
Minimum:
100.0
jan 1, 2001
Maximum:
578.229
jan 1, 2016
At the date of observation
Value
Absolute change
Change from the previous value
jan 1, 2001
100.0
+100.0
0.0%
jan 1, 2002
110.747
+10.747
10.75%
jan 1, 2003
122.249
+11.502
10.39%
jan 1, 2004
134.9
+12.651
10.35%
jan 1, 2005
158.319
+23.419
17.36%
jan 1, 2006
170.262
+11.943
7.54%
jan 1, 2007
194.796
+24.534
14.41%
jan 1, 2008
221.566
+26.77
13.74%
jan 1, 2009
229.174
+7.608
3.43%
jan 1, 2010
236.937
+7.764
3.39%
jan 1, 2011
270.792
+33.854
14.29%
jan 1, 2012
303.736
+32.944
12.17%
jan 1, 2013
360.778
+57.042
18.78%
jan 1, 2014
426.143
+65.366
18.12%
jan 1, 2015
480.384
+54.24
12.73%
jan 1, 2016
578.229
+97.846
20.37%
Ranking of countries by current statistics by years