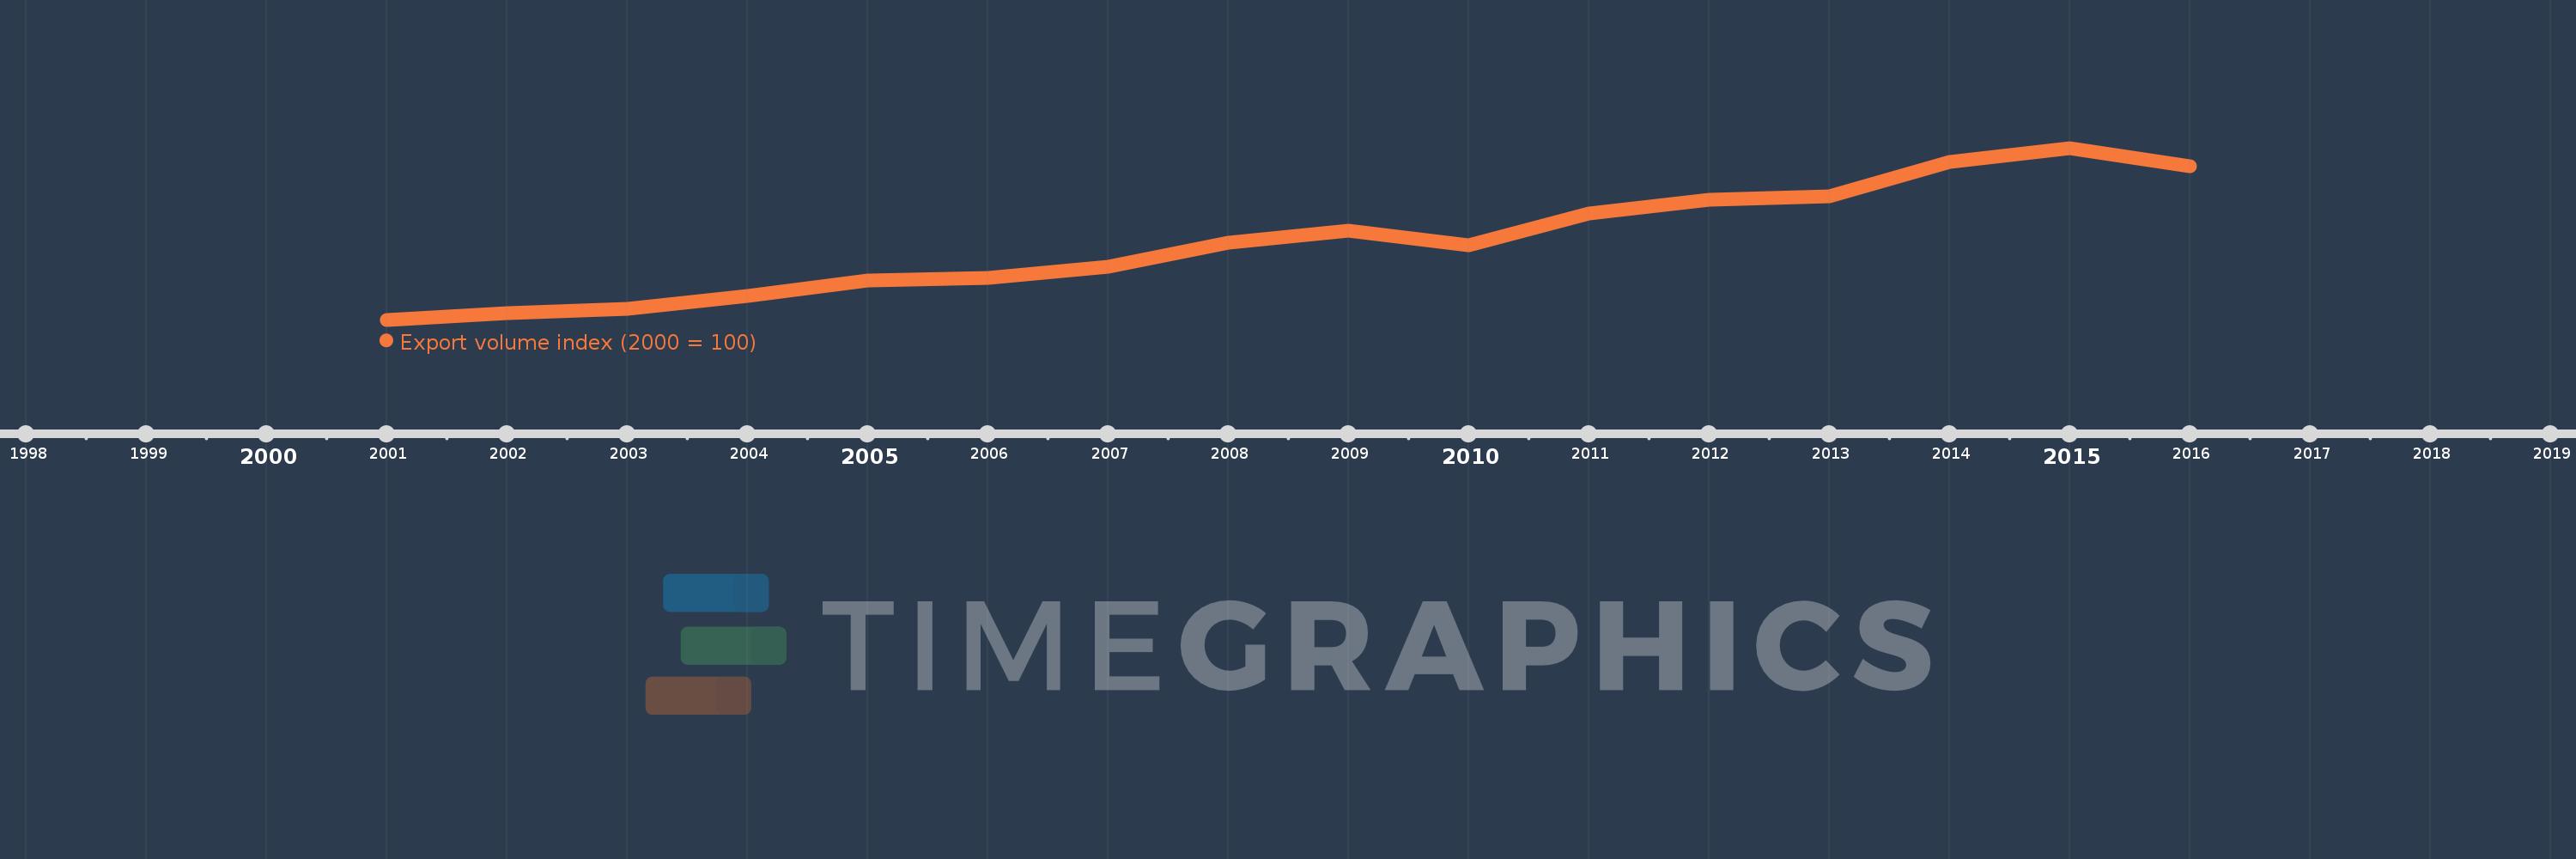
This timeline shows a graph from 2001 to 2016 of Albania. No data until 2000. Number of actual observations by date: 16.
Source name:
World Development Indicators
Source organization:
United Nations Conference on Trade and Development, Handbook of Statistics and data files, and International Monetary Fund, International Financial Statistics.
Categories, topics:
Private Sector, Trade
Last updated:
apr 23, 2017
Indicators value changes by year
Meaning:
332.804
Minimum:
100.0
jan 1, 2001
Maximum:
612.417
jan 1, 2015
At the date of observation
Value
Absolute change
Change from the previous value
jan 1, 2001
100.0
+100.0
0.0%
jan 1, 2002
118.824
+18.824
18.82%
jan 1, 2003
132.484
+13.66
11.5%
jan 1, 2004
170.729
+38.245
28.87%
jan 1, 2005
217.186
+46.457
27.21%
jan 1, 2006
225.149
+7.962
3.67%
jan 1, 2007
258.509
+33.361
14.82%
jan 1, 2008
330.518
+72.009
27.86%
jan 1, 2009
365.916
+35.399
10.71%
jan 1, 2010
323.112
-42.805
-11.7%
jan 1, 2011
416.233
+93.121
28.82%
jan 1, 2012
458.195
+41.962
10.08%
jan 1, 2013
467.977
+9.782
2.13%
jan 1, 2014
569.458
+101.482
21.69%
jan 1, 2015
612.417
+42.958
7.54%
jan 1, 2016
558.154
-54.263
-8.86%
Ranking of countries by current statistics by years