33
/
AIzaSyAYiBZKx7MnpbEhh9jyipgxe19OcubqV5w
August 1, 2025
250711
St. Lucia
LCA
true
2
1
Export volume index (2000 = 100)
2016,2015,2014,2013,2012,2011,2010,2009,2008,2007,2006,2005,2004,2003,2002,2001,1984,1983,1982,1981
Download
Global statistics library →St. Lucia →

Export volume index (2000 = 100)

This statistics in other country:

AfghanistanAlbaniaAlgeriaAmerican SamoaAndorraAngolaAntigua and BarbudaArgentinaArmeniaArubaAustraliaAustriaAzerbaijanBahamas, TheBahrainBangladeshBarbadosBelarusBelgiumBelizeBeninBermudaBhutanBoliviaBosnia and HerzegovinaBotswanaBrazilBritish Virgin IslandsBrunei DarussalamBulgariaBurkina FasoBurundiCabo VerdeCambodiaCameroonCanadaCayman IslandsCentral African RepublicChadChileChinaColombiaComorosCongo, Dem. Rep.Congo, Rep.Costa RicaCote d'IvoireCroatiaCubaCuracaoCyprusCzech RepublicDenmarkDjiboutiDominicaDominican RepublicEcuadorEgypt, Arab Rep.El SalvadorEquatorial GuineaEritreaEstoniaEthiopiaFaroe IslandsFijiFinlandFranceFrench PolynesiaGabonGambia, TheGeorgiaGermanyGhanaGibraltarGreeceGreenlandGrenadaGuamGuatemalaGuineaGuinea-BissauGuyanaHaitiHondurasHong Kong SAR, ChinaHungaryIcelandIndiaIndonesiaIran, Islamic Rep.IraqIrelandIsraelItalyJamaicaJapanJordanKazakhstanKenyaKiribatiKorea, Dem. People’s Rep.Korea, Rep.KuwaitKyrgyz RepublicLao PDRLatviaLebanonLesothoLiberiaLibyaLithuaniaLuxembourgMacao SAR, ChinaMacedonia, FYRMadagascarMalawiMalaysiaMaldivesMaliMaltaMarshall IslandsMauritaniaMauritiusMexicoMicronesia, Fed. Sts.MoldovaMongoliaMoroccoMozambiqueMyanmarNamibiaNauruNepalNetherlandsNew CaledoniaNew ZealandNicaraguaNigerNigeriaNorthern Mariana IslandsNorwayOmanPakistanPalauPanamaPapua New GuineaParaguayPeruPhilippinesPolandPortugalQatarRomaniaRussian FederationRwandaSamoaSao Tome and PrincipeSaudi ArabiaSenegalSerbiaSeychellesSierra LeoneSingaporeSlovak RepublicSloveniaSolomon IslandsSomaliaSouth AfricaSpainSri LankaSt. Kitts and NevisSt. LuciaSt. Vincent and the GrenadinesSudanSurinameSwazilandSwedenSwitzerlandSyrian Arab RepublicTajikistanTanzaniaThailandTogoTongaTrinidad and TobagoTunisiaTurkeyTurkmenistanTurks and Caicos IslandsUgandaUkraineUnited Arab EmiratesUnited KingdomUnited StatesUruguayUzbekistanVanuatuVenezuela, RBVietnamWest Bank and GazaYemen, Rep.ZambiaZimbabwe

Timeline:

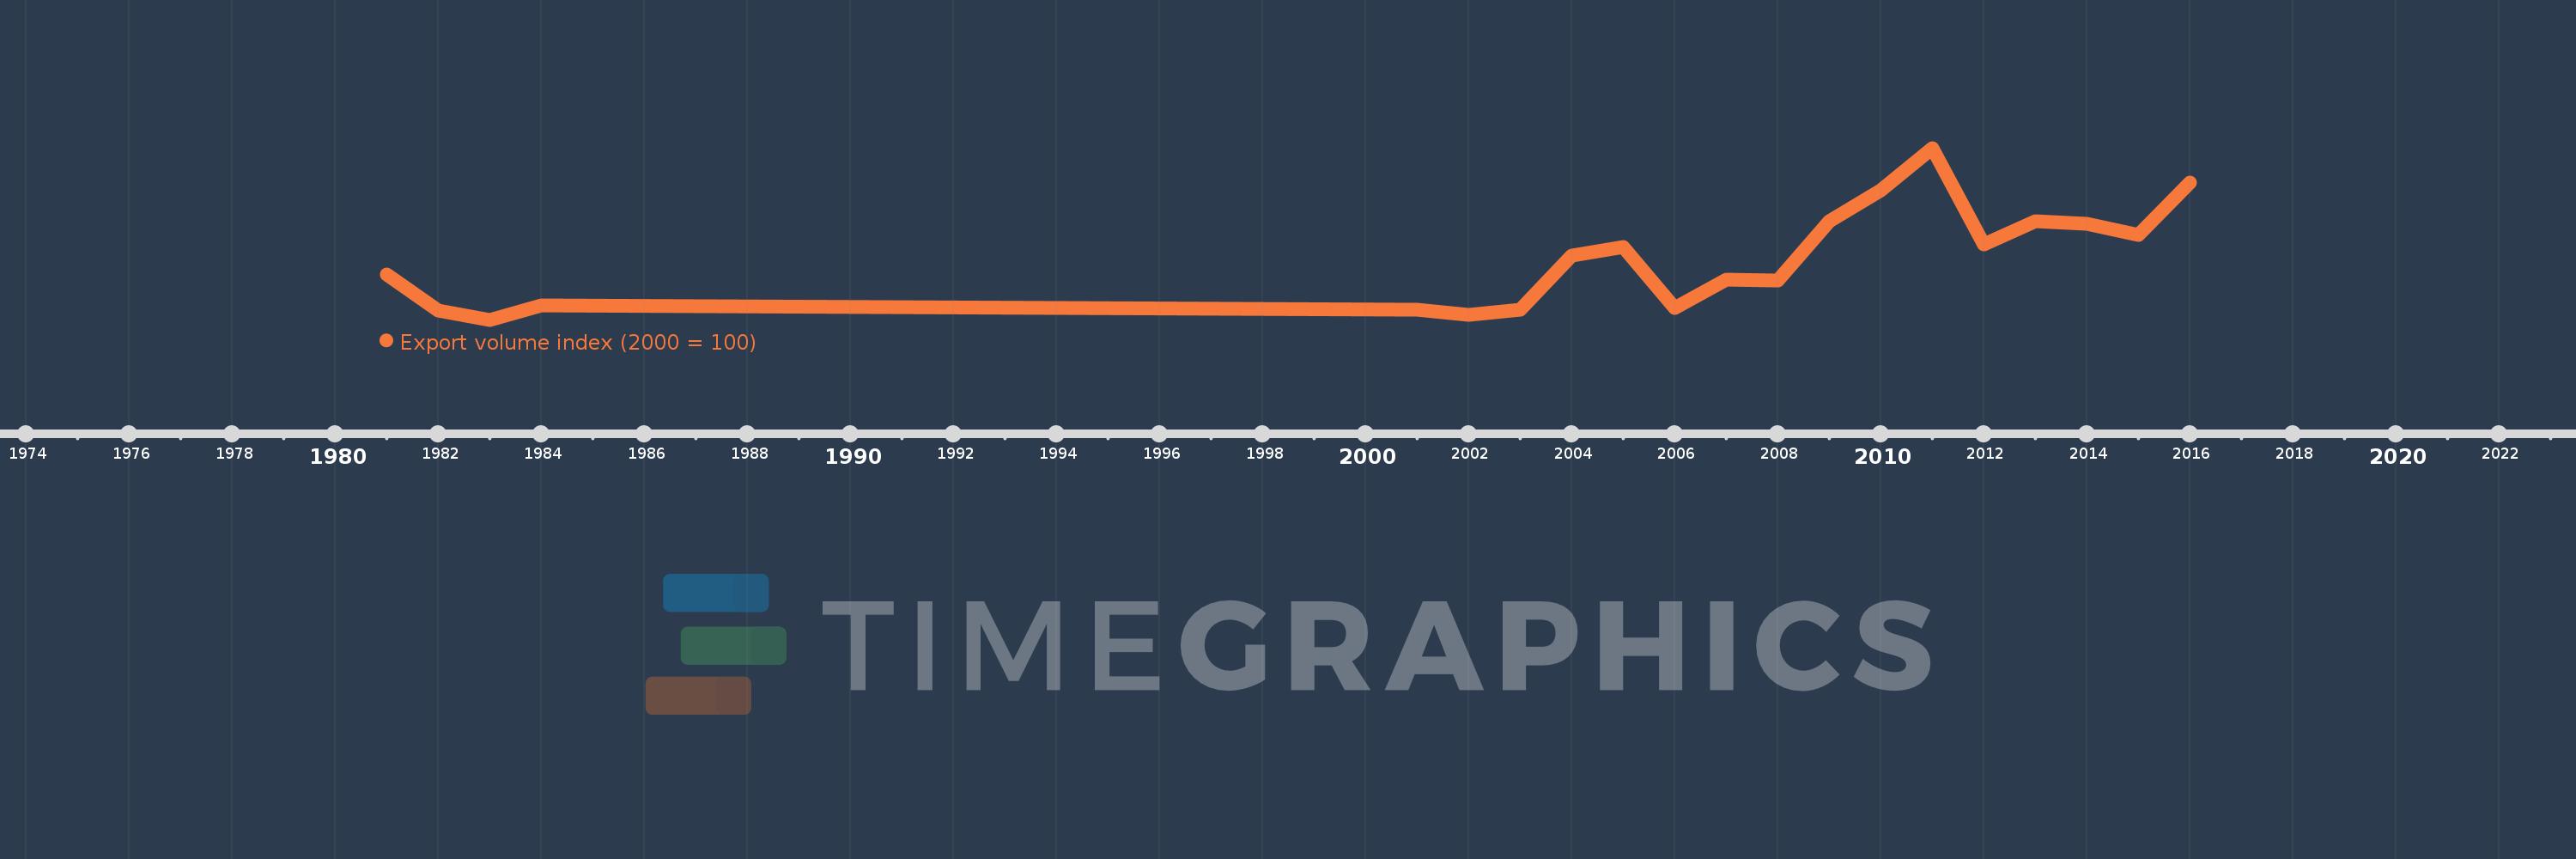
This timeline shows a graph from 1981 to 2016 of St. Lucia. No data until 1980. Number of actual observations by date: 20.

Source name:

World Development Indicators

Source organization:

United Nations Conference on Trade and Development, Handbook of Statistics and data files, and International Monetary Fund, International Financial Statistics.

Categories, topics:

Private Sector, Trade

Last updated:

apr 23, 2017

Indicators value changes by year

Meaning:
149.376
Minimum:
89.944
jan 1, 1983
Maximum:
257.999
jan 1, 2011
At the date of observation
Value
Absolute change
Change from the previous value
jan 1, 1981
134.435
+134.435
0.0%
jan 1, 1982
98.906
-35.529
-26.43%
jan 1, 1983
89.944
-8.962
-9.06%
jan 1, 1984
103.644
+13.701
15.23%
jan 1, 2001
100.0
-3.644
-3.52%
jan 1, 2002
95.1
-4.9
-4.9%
jan 1, 2003
100.083
+4.983
5.24%
jan 1, 2004
152.577
+52.494
52.45%
jan 1, 2005
161.535
+8.957
5.87%
jan 1, 2006
101.339
-60.196
-37.27%
jan 1, 2007
129.574
+28.236
27.86%
jan 1, 2008
128.372
-1.202
-0.93%
jan 1, 2009
186.098
+57.725
44.97%
jan 1, 2010
216.57
+30.473
16.37%
jan 1, 2011
257.999
+41.429
19.13%
jan 1, 2012
163.765
-94.234
-36.53%
jan 1, 2013
186.377
+22.612
13.81%
jan 1, 2014
184.007
-2.369
-1.27%
jan 1, 2015
172.942
-11.066
-6.01%
jan 1, 2016
224.257
+51.316
29.67%

Ranking of countries by current statistics by years