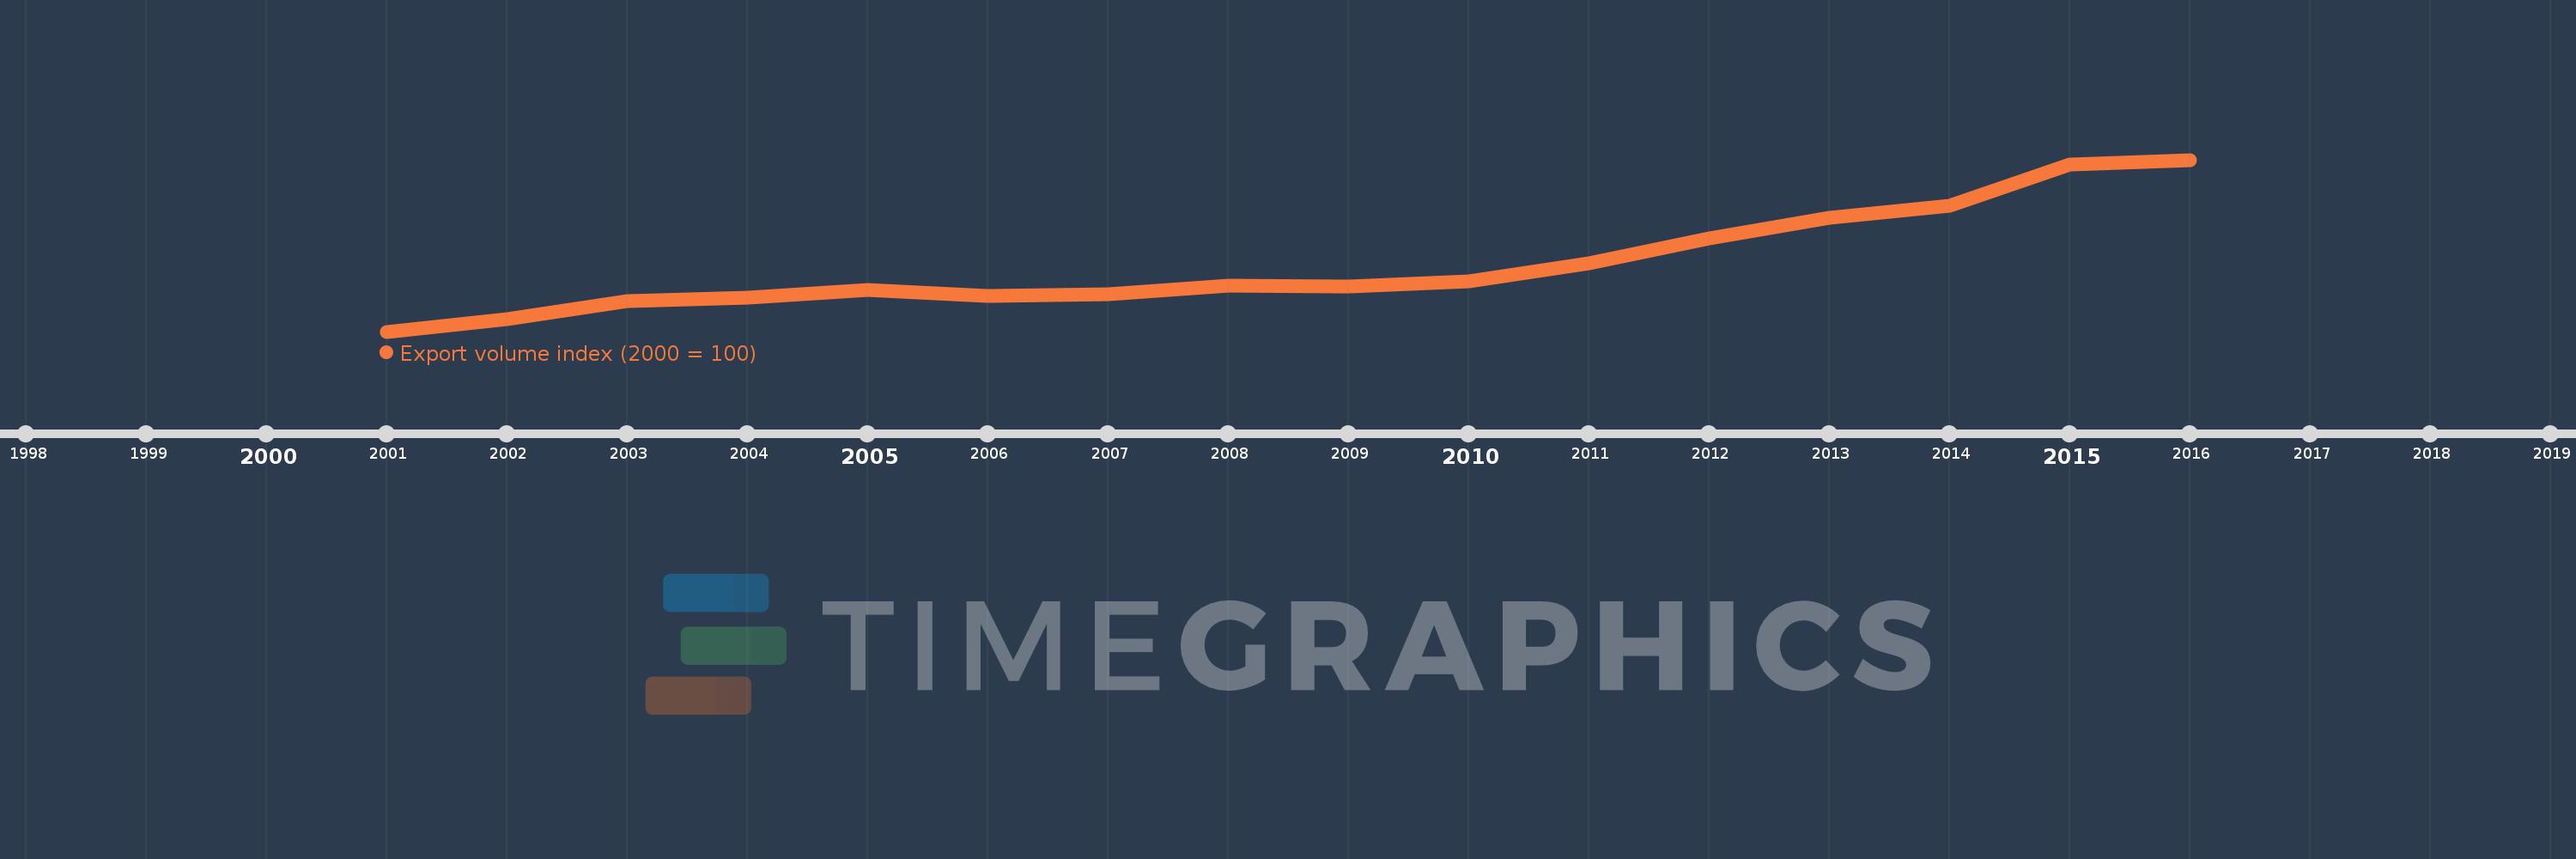
This timeline shows a graph from 2001 to 2016 of Korea, Dem. People’s Rep.. No data until 2000. Number of actual observations by date: 16.
Source name:
World Development Indicators
Source organization:
United Nations Conference on Trade and Development, Handbook of Statistics and data files, and International Monetary Fund, International Financial Statistics.
Categories, topics:
Private Sector, Trade
Last updated:
apr 23, 2017
Indicators value changes by year
Meaning:
224.206
Minimum:
100.0
jan 1, 2001
Maximum:
418.503
jan 1, 2016
At the date of observation
Value
Absolute change
Change from the previous value
jan 1, 2001
100.0
+100.0
0.0%
jan 1, 2002
123.257
+23.257
23.26%
jan 1, 2003
157.159
+33.901
27.5%
jan 1, 2004
162.109
+4.95
3.15%
jan 1, 2005
177.123
+15.014
9.26%
jan 1, 2006
166.838
-10.286
-5.81%
jan 1, 2007
169.812
+2.975
1.78%
jan 1, 2008
185.237
+15.425
9.08%
jan 1, 2009
183.048
-2.189
-1.18%
jan 1, 2010
192.683
+9.635
5.26%
jan 1, 2011
226.049
+33.366
17.32%
jan 1, 2012
272.482
+46.433
20.54%
jan 1, 2013
310.736
+38.254
14.04%
jan 1, 2014
333.258
+22.522
7.25%
jan 1, 2015
408.998
+75.74
22.73%
jan 1, 2016
418.503
+9.505
2.32%
Ranking of countries by current statistics by years