This timeline shows a graph from 1981 to 2016 of Liberia. No data until 1980. Number of actual observations by date: 24.
Source name:
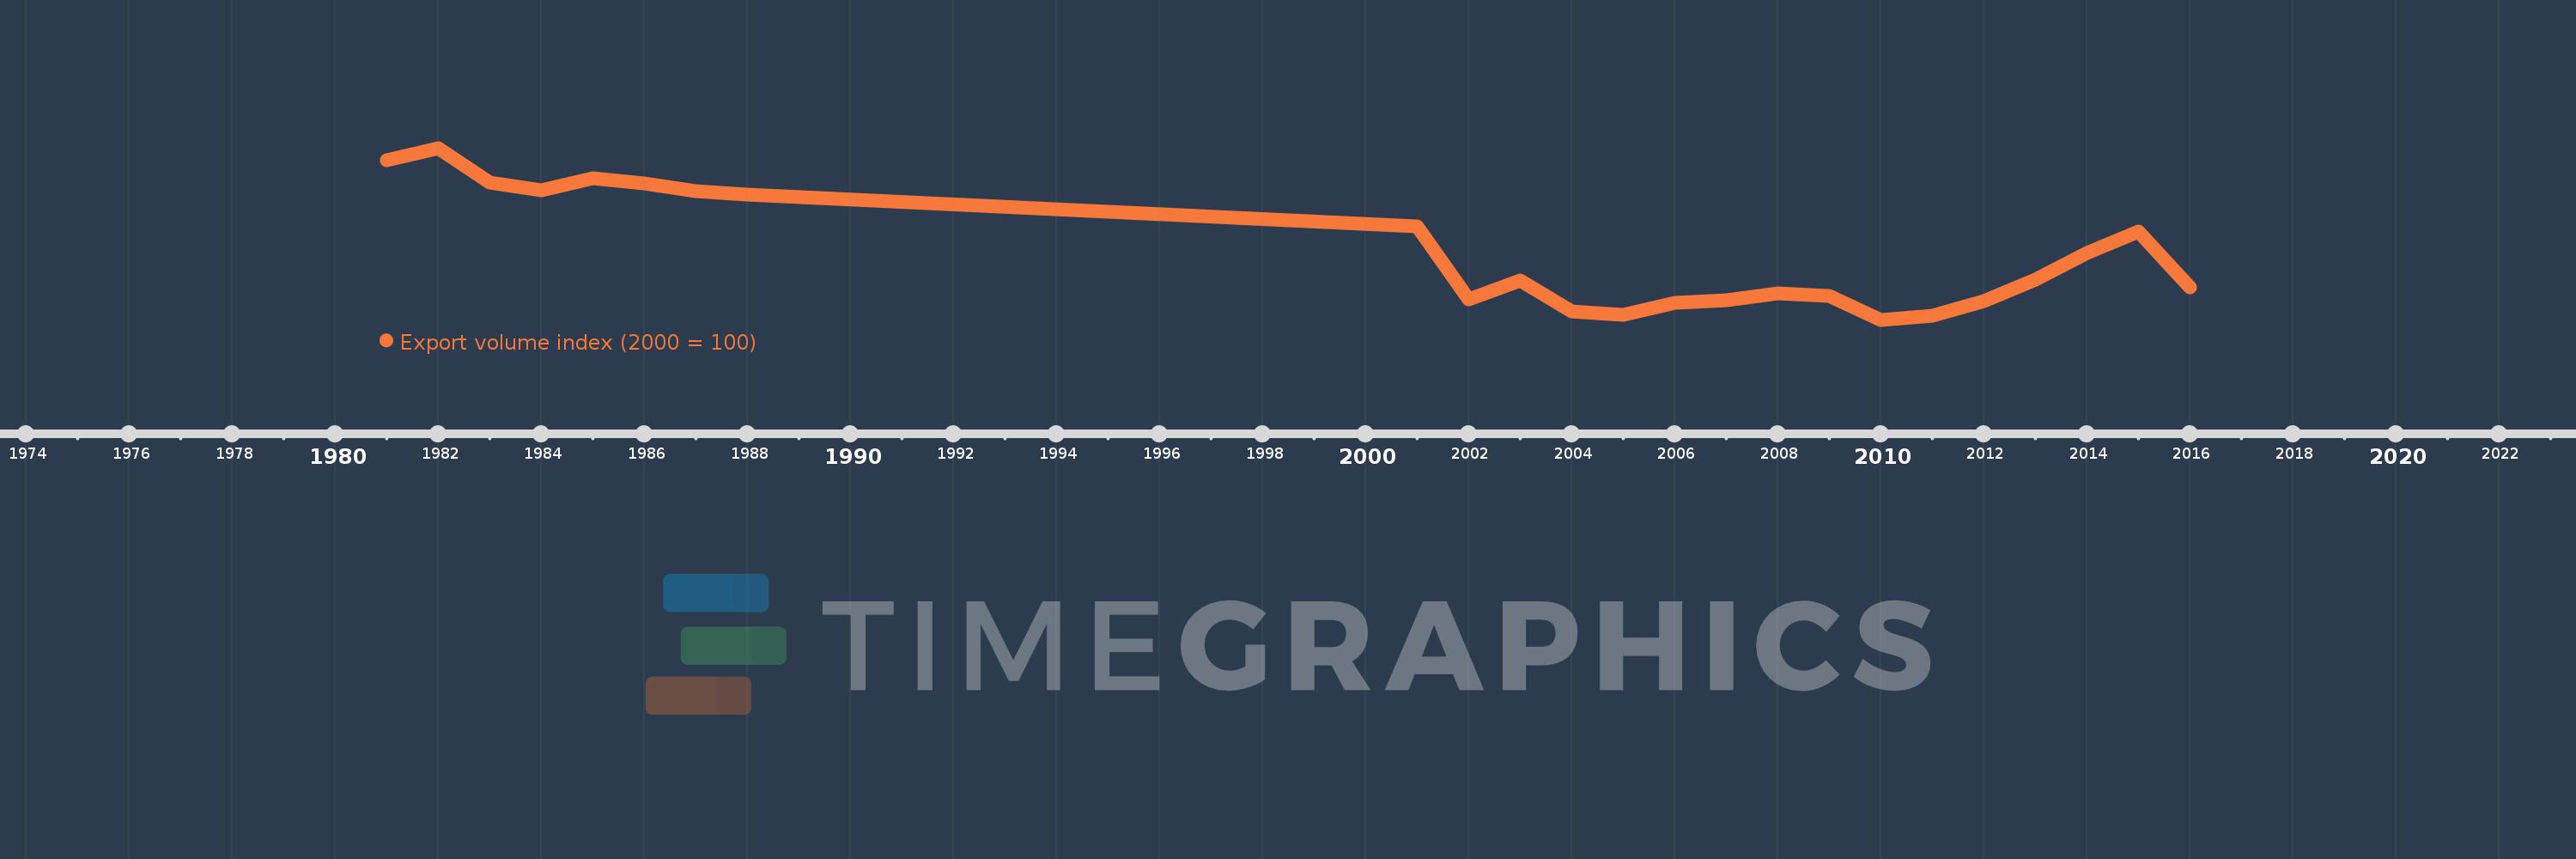
World Development Indicators
Source organization:
United Nations Conference on Trade and Development, Handbook of Statistics and data files, and International Monetary Fund, International Financial Statistics.
Categories, topics:
Private Sector, Trade
Last updated:
apr 23, 2017
Indicators value changes by year
Meaning:
80.216
Minimum:
28.003
jan 1, 2010
Maximum:
159.873
jan 1, 1982
At the date of observation
Value
Absolute change
Change from the previous value
jan 1, 1981
150.755
+150.755
0.0%
jan 1, 1982
159.873
+9.118
6.05%
jan 1, 1983
133.07
-26.803
-16.77%
jan 1, 1984
127.532
-5.538
-4.16%
jan 1, 1985
136.735
+9.202
7.22%
jan 1, 1986
132.401
-4.334
-3.17%
jan 1, 1987
126.414
-5.987
-4.52%
jan 1, 1988
124.165
-2.249
-1.78%
jan 1, 2001
100.0
-24.165
-19.46%
jan 1, 2002
43.867
-56.133
-56.13%
jan 1, 2003
58.007
+14.141
32.24%
jan 1, 2004
34.551
-23.457
-40.44%
jan 1, 2005
31.481
-3.07
-8.88%
jan 1, 2006
41.133
+9.652
30.66%
jan 1, 2007
42.836
+1.703
4.14%
jan 1, 2008
48.351
+5.514
12.87%
jan 1, 2009
46.475
-1.876
-3.88%
jan 1, 2010
28.003
-18.472
-39.75%
jan 1, 2011
31.167
+3.164
11.3%
jan 1, 2012
42.346
+11.179
35.87%
jan 1, 2013
58.552
+16.206
38.27%
jan 1, 2014
78.955
+20.403
34.85%
jan 1, 2015
95.458
+16.503
20.9%
jan 1, 2016
53.064
-42.394
-44.41%
Ranking of countries by current statistics by years