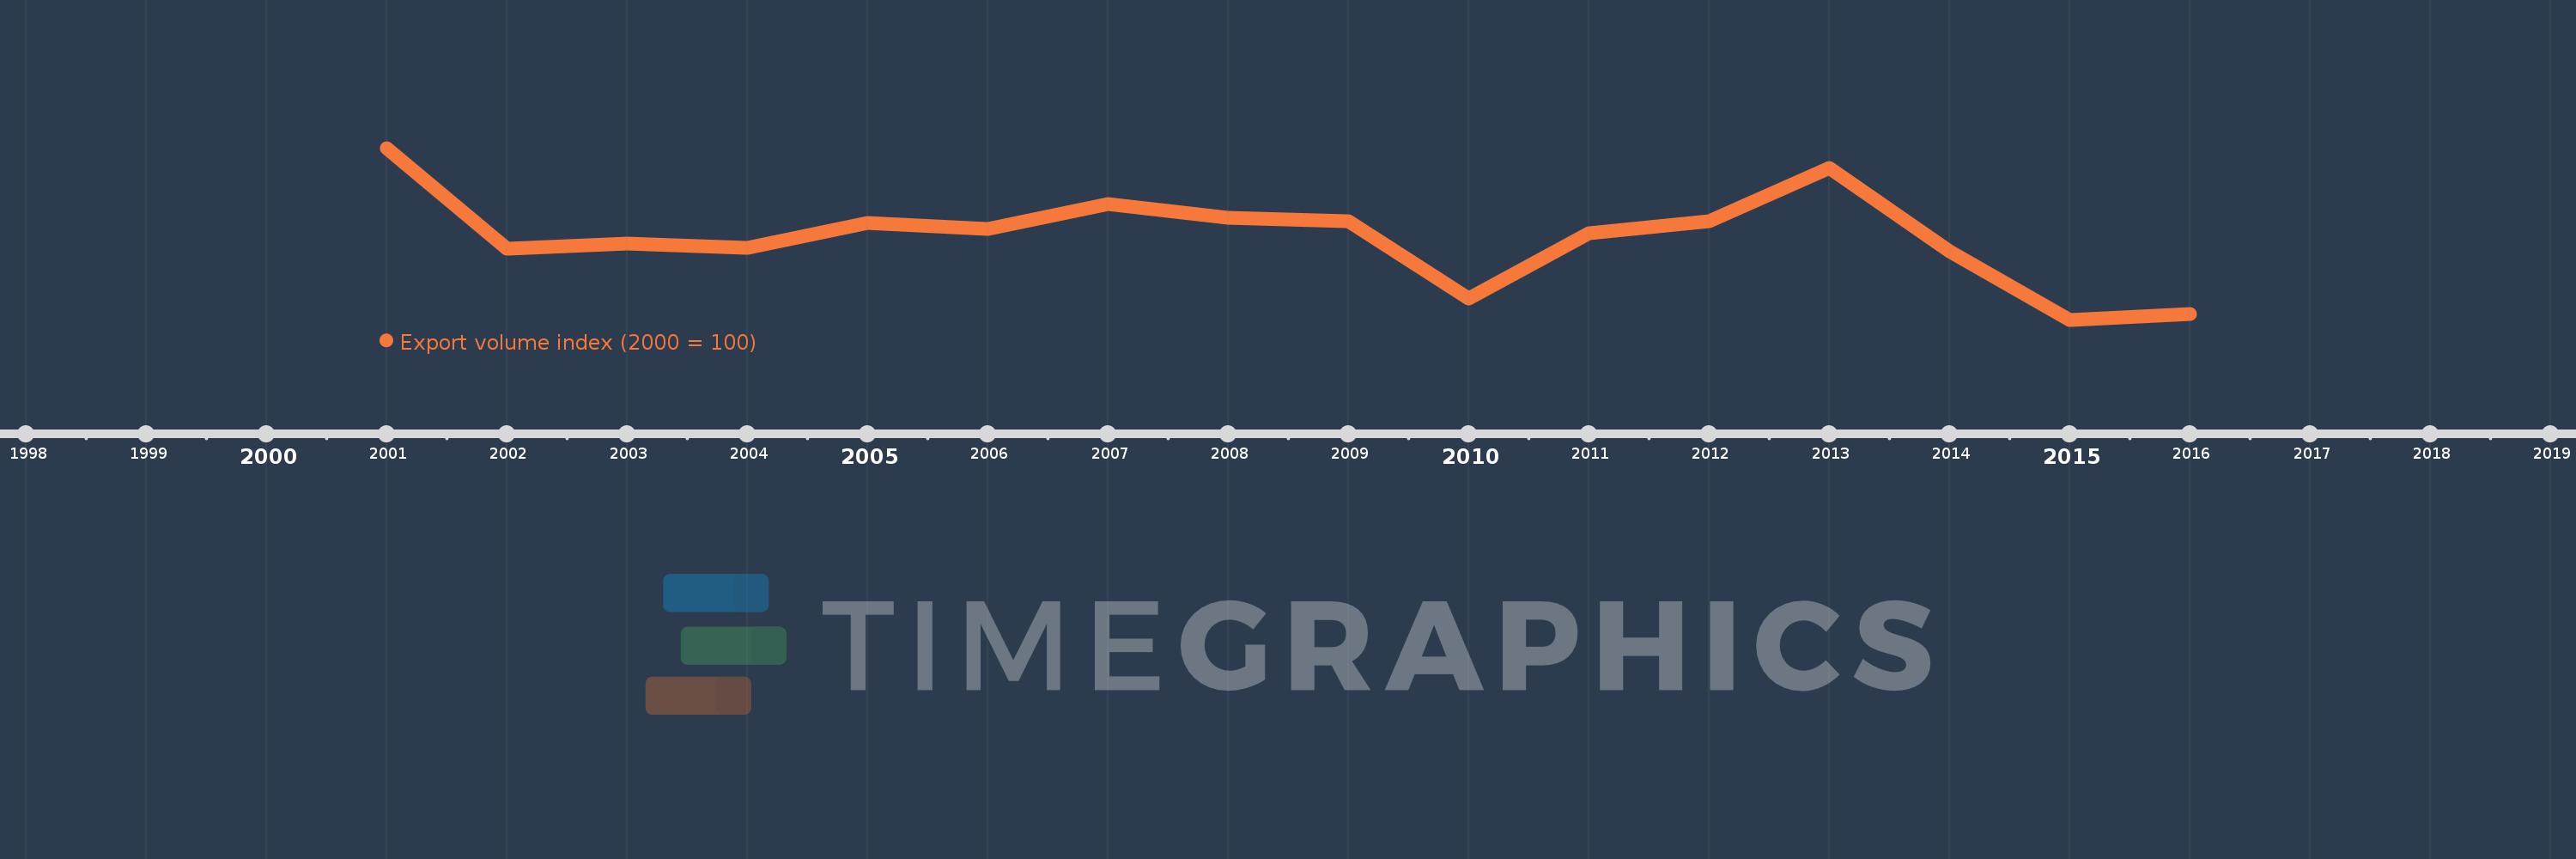
This timeline shows a graph from 2001 to 2016 of Malta. No data until 2000. Number of actual observations by date: 16.
Source name:
World Development Indicators
Source organization:
United Nations Conference on Trade and Development, Handbook of Statistics and data files, and International Monetary Fund, International Financial Statistics.
Categories, topics:
Private Sector, Trade
Last updated:
apr 23, 2017
Indicators value changes by year
Meaning:
81.573
Minimum:
64.405
jan 1, 2015
Maximum:
100.0
jan 1, 2001
At the date of observation
Value
Absolute change
Change from the previous value
jan 1, 2001
100.0
+100.0
0.0%
jan 1, 2002
79.104
-20.896
-20.9%
jan 1, 2003
80.128
+1.024
1.29%
jan 1, 2004
79.37
-0.758
-0.95%
jan 1, 2005
84.375
+5.005
6.31%
jan 1, 2006
83.139
-1.236
-1.46%
jan 1, 2007
88.397
+5.258
6.32%
jan 1, 2008
85.512
-2.885
-3.26%
jan 1, 2009
84.86
-0.652
-0.76%
jan 1, 2010
68.833
-16.027
-18.89%
jan 1, 2011
82.27
+13.437
19.52%
jan 1, 2012
84.756
+2.486
3.02%
jan 1, 2013
95.909
+11.154
13.16%
jan 1, 2014
78.524
-17.385
-18.13%
jan 1, 2015
64.405
-14.119
-17.98%
jan 1, 2016
65.589
+1.183
1.84%
Ranking of countries by current statistics by years