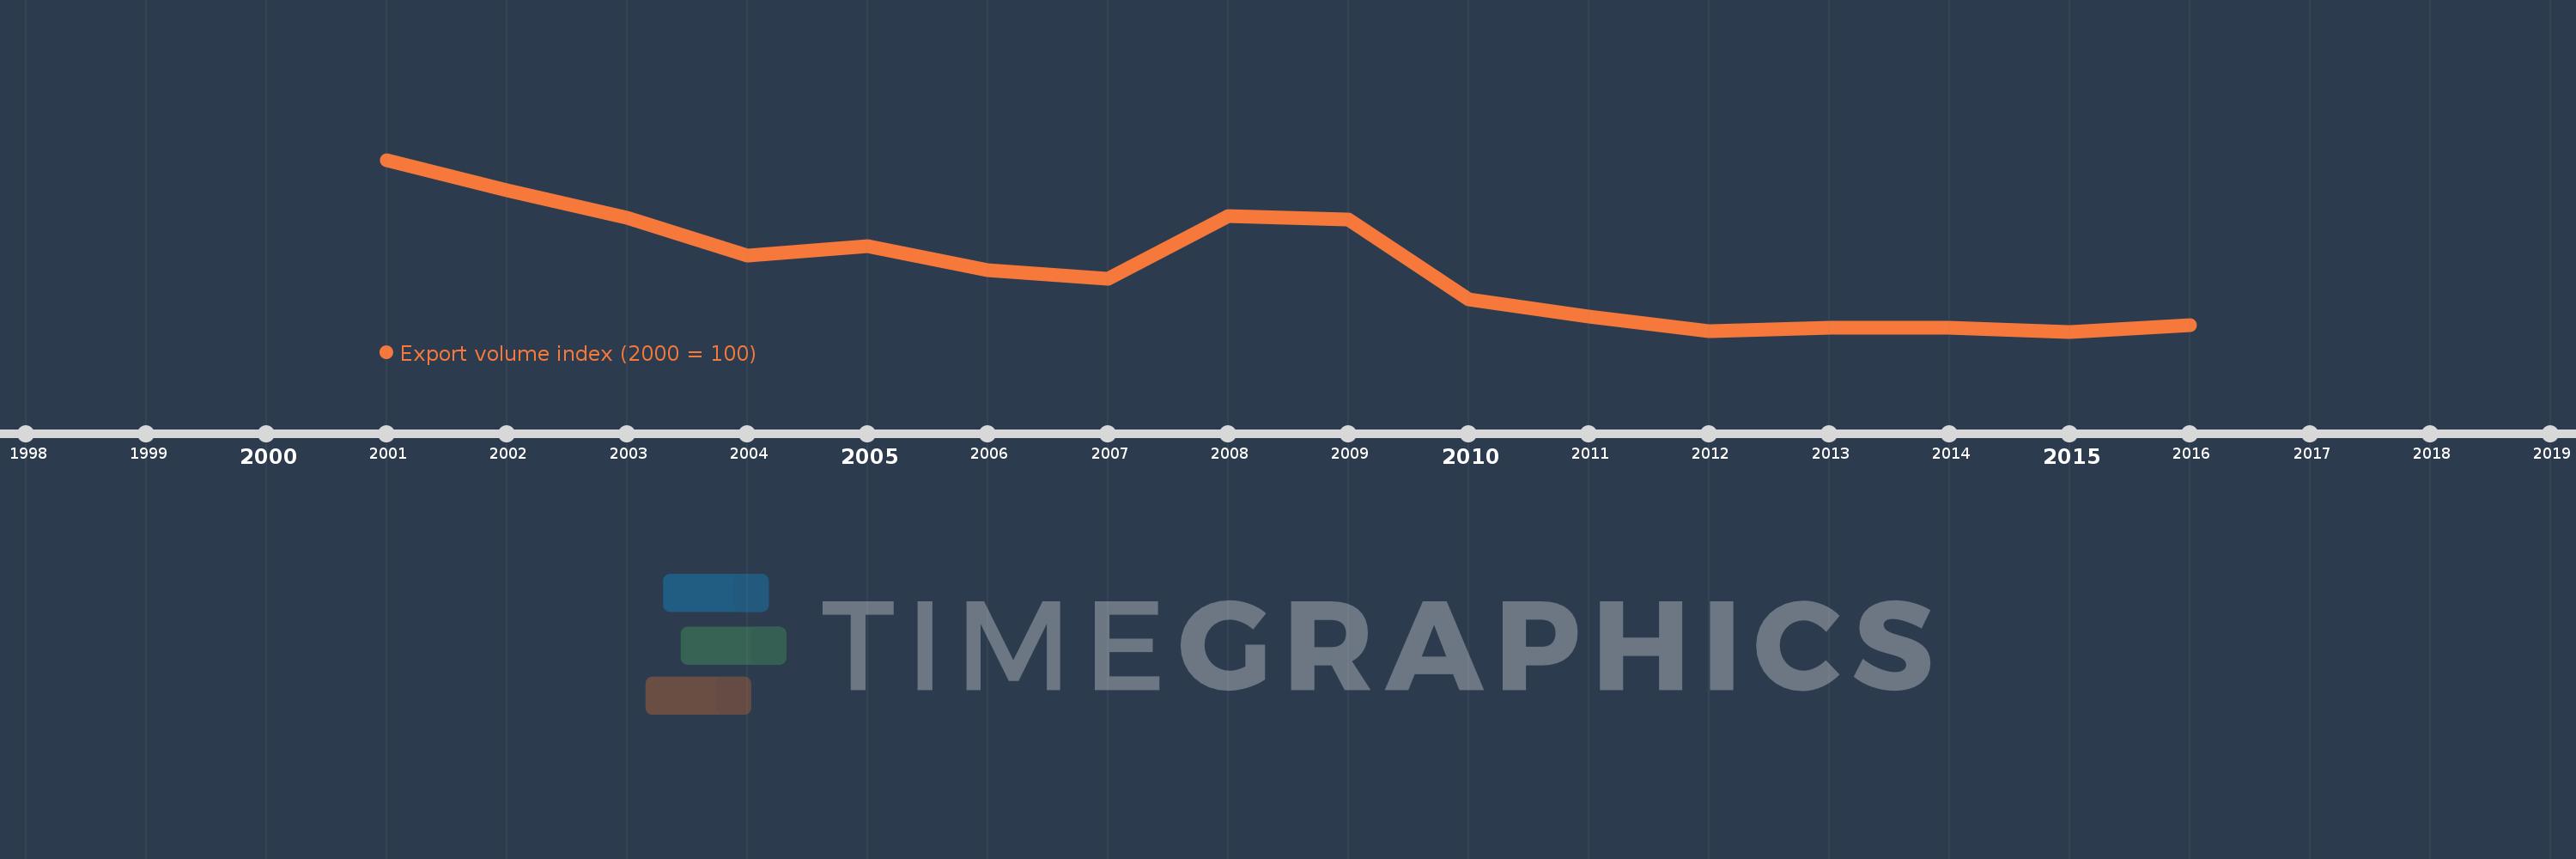
This timeline shows a graph from 2001 to 2016 of Guam. No data until 2000. Number of actual observations by date: 16.
Source name:
World Development Indicators
Source organization:
United Nations Conference on Trade and Development, Handbook of Statistics and data files, and International Monetary Fund, International Financial Statistics.
Categories, topics:
Private Sector, Trade
Last updated:
apr 23, 2017
Indicators value changes by year
Meaning:
50.673
Minimum:
22.821
jan 1, 2015
Maximum:
100.0
jan 1, 2001
At the date of observation
Value
Absolute change
Change from the previous value
jan 1, 2001
100.0
+100.0
0.0%
jan 1, 2002
86.293
-13.707
-13.71%
jan 1, 2003
73.868
-12.425
-14.4%
jan 1, 2004
56.945
-16.924
-22.91%
jan 1, 2005
61.214
+4.27
7.5%
jan 1, 2006
50.336
-10.879
-17.77%
jan 1, 2007
46.724
-3.612
-7.18%
jan 1, 2008
74.597
+27.873
59.65%
jan 1, 2009
73.141
-1.456
-1.95%
jan 1, 2010
37.455
-35.686
-48.79%
jan 1, 2011
29.668
-7.786
-20.79%
jan 1, 2012
22.96
-6.708
-22.61%
jan 1, 2013
24.517
+1.557
6.78%
jan 1, 2014
24.615
+0.097
0.4%
jan 1, 2015
22.821
-1.794
-7.29%
jan 1, 2016
25.608
+2.787
12.21%
Ranking of countries by current statistics by years