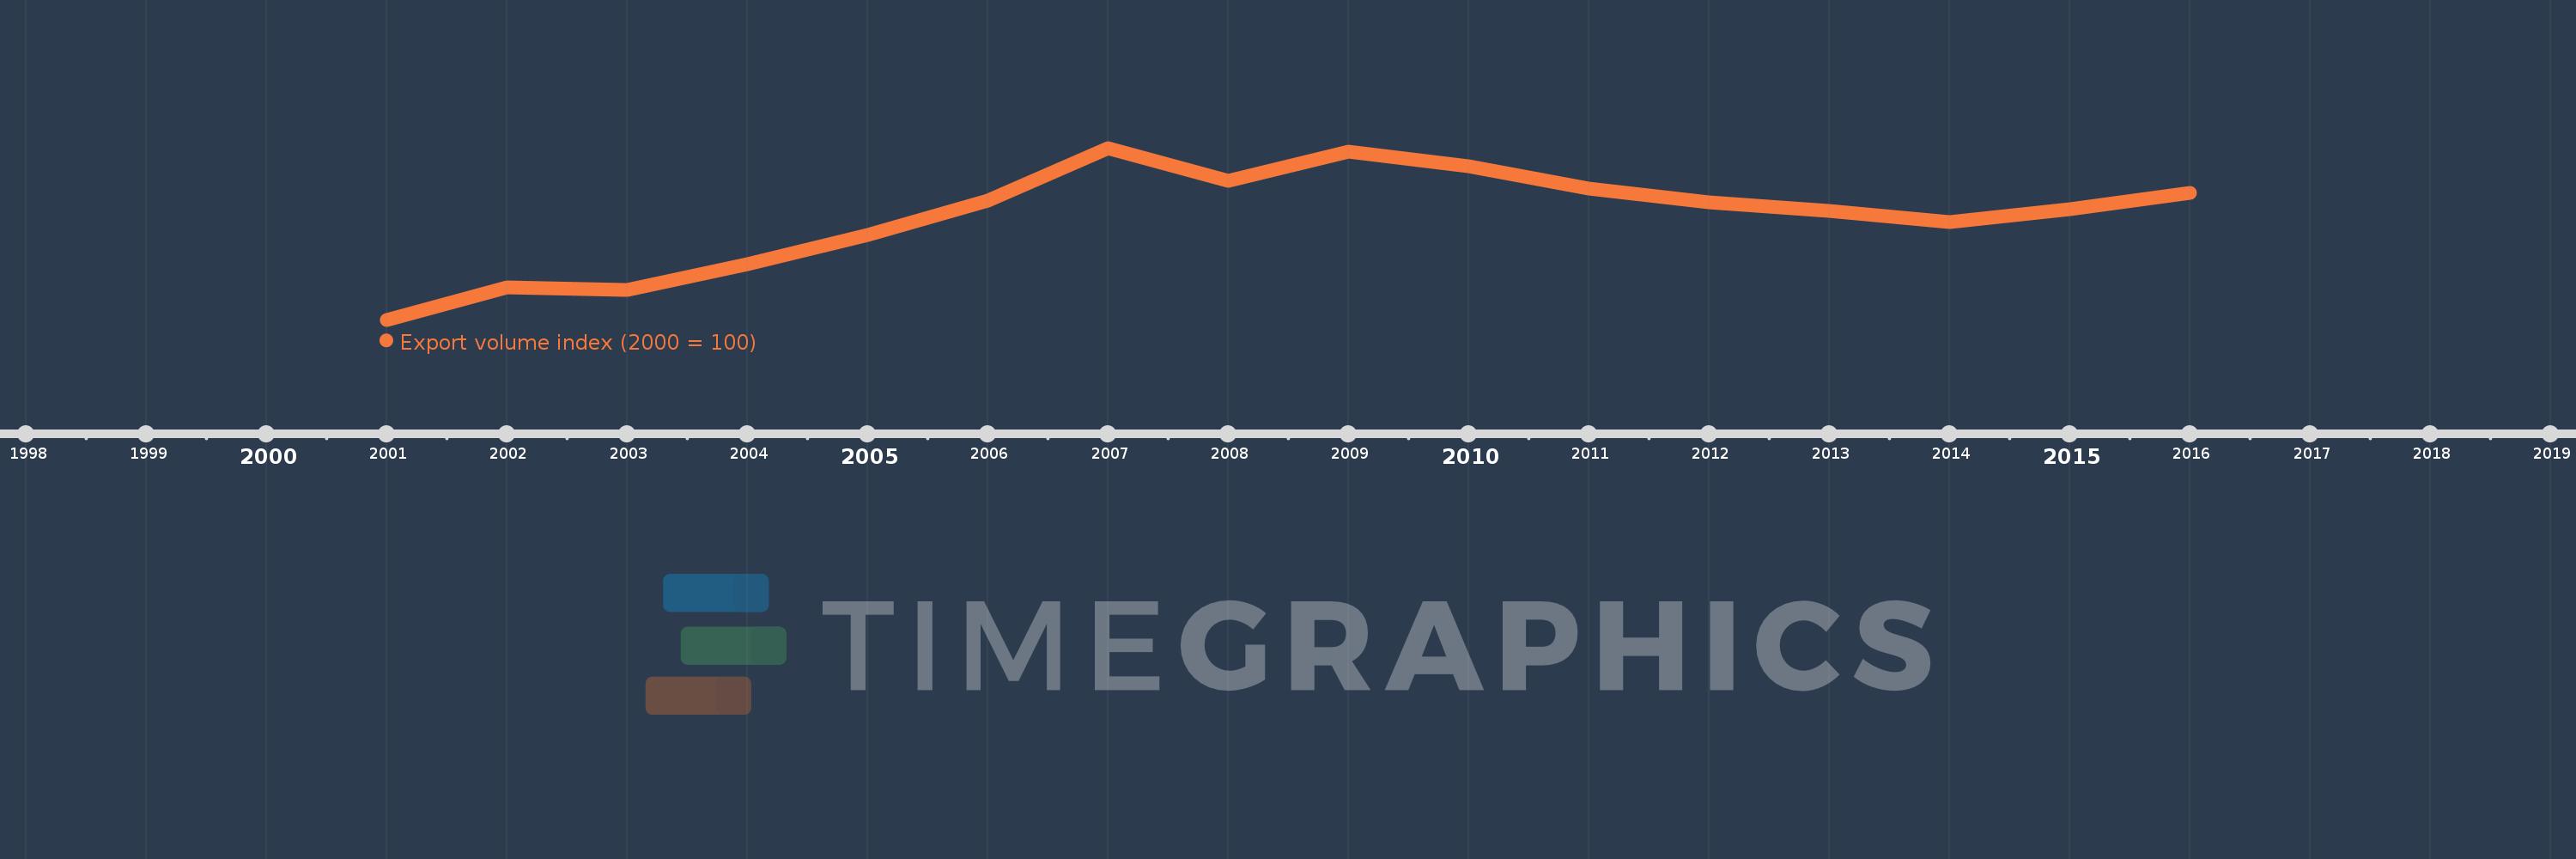
This timeline shows a graph from 2001 to 2016 of Luxembourg. No data until 2000. Number of actual observations by date: 16.
Source name:
World Development Indicators
Source organization:
United Nations Conference on Trade and Development, Handbook of Statistics and data files, and International Monetary Fund, International Financial Statistics.
Categories, topics:
Private Sector, Trade
Last updated:
apr 23, 2017
Indicators value changes by year
Meaning:
168.133
Minimum:
100.0
jan 1, 2001
Maximum:
213.685
jan 1, 2007
At the date of observation
Value
Absolute change
Change from the previous value
jan 1, 2001
100.0
+100.0
0.0%
jan 1, 2002
121.618
+21.618
21.62%
jan 1, 2003
119.543
-2.075
-1.71%
jan 1, 2004
136.745
+17.202
14.39%
jan 1, 2005
156.239
+19.494
14.26%
jan 1, 2006
179.088
+22.849
14.62%
jan 1, 2007
213.685
+34.597
19.32%
jan 1, 2008
192.011
-21.673
-10.14%
jan 1, 2009
211.224
+19.213
10.01%
jan 1, 2010
201.856
-9.368
-4.44%
jan 1, 2011
186.738
-15.118
-7.49%
jan 1, 2012
177.677
-9.062
-4.85%
jan 1, 2013
171.881
-5.795
-3.26%
jan 1, 2014
164.909
-6.972
-4.06%
jan 1, 2015
172.997
+8.088
4.9%
jan 1, 2016
183.923
+10.926
6.32%
Ranking of countries by current statistics by years