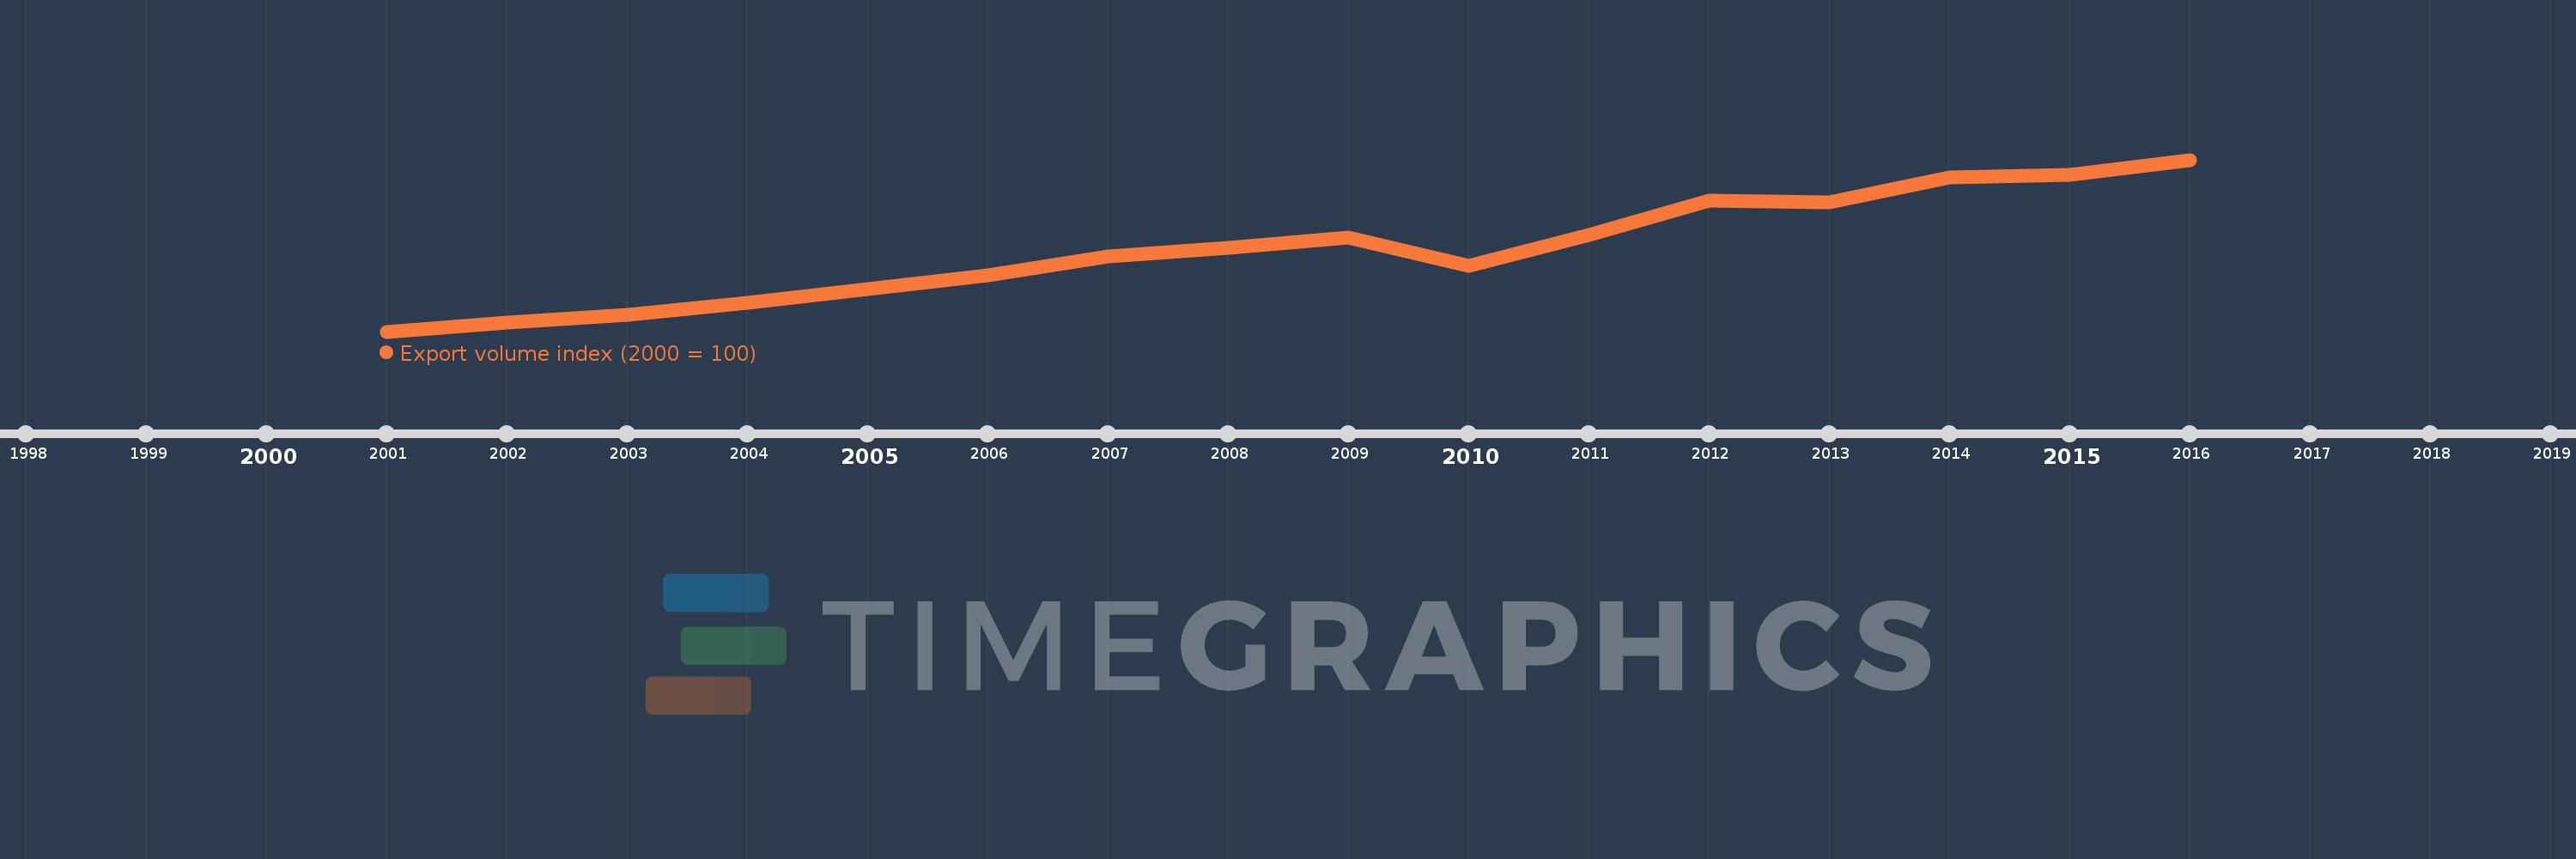
This timeline shows a graph from 2001 to 2016 of Bulgaria. No data until 2000. Number of actual observations by date: 16.
Source name:
World Development Indicators
Source organization:
United Nations Conference on Trade and Development, Handbook of Statistics and data files, and International Monetary Fund, International Financial Statistics.
Categories, topics:
Private Sector, Trade
Last updated:
apr 23, 2017
Indicators value changes by year
Meaning:
191.698
Minimum:
100.0
jan 1, 2001
Maximum:
292.138
jan 1, 2016
At the date of observation
Value
Absolute change
Change from the previous value
jan 1, 2001
100.0
+100.0
0.0%
jan 1, 2002
110.485
+10.485
10.48%
jan 1, 2003
119.059
+8.574
7.76%
jan 1, 2004
132.564
+13.505
11.34%
jan 1, 2005
147.095
+14.531
10.96%
jan 1, 2006
162.621
+15.526
10.56%
jan 1, 2007
183.677
+21.057
12.95%
jan 1, 2008
193.247
+9.57
5.21%
jan 1, 2009
205.318
+12.071
6.25%
jan 1, 2010
173.713
-31.605
-15.39%
jan 1, 2011
208.235
+34.522
19.87%
jan 1, 2012
246.837
+38.602
18.54%
jan 1, 2013
244.418
-2.418
-0.98%
jan 1, 2014
272.233
+27.815
11.38%
jan 1, 2015
275.524
+3.29
1.21%
jan 1, 2016
292.138
+16.615
6.03%
Ranking of countries by current statistics by years