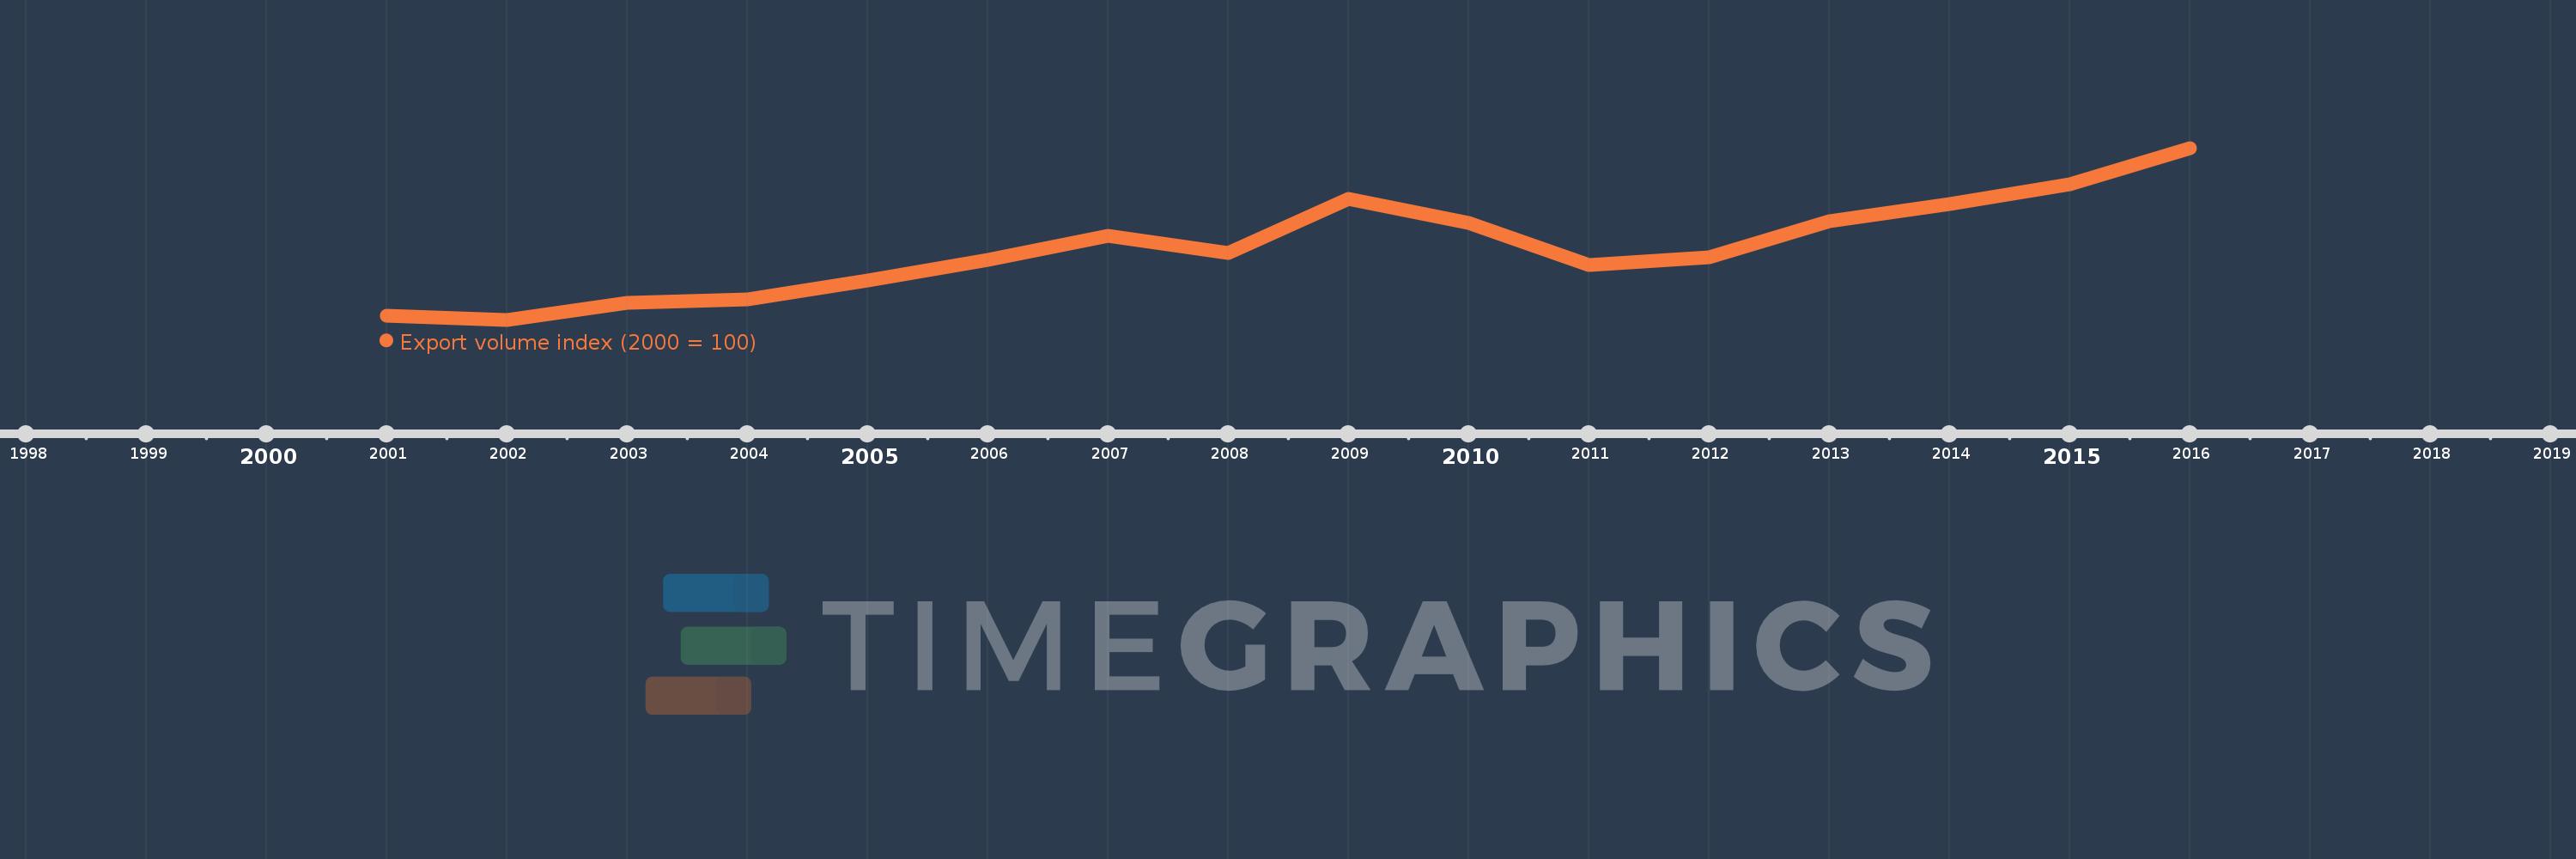
This timeline shows a graph from 2001 to 2016 of Turks and Caicos Islands. No data until 2000. Number of actual observations by date: 16.
Source name:
World Development Indicators
Source organization:
United Nations Conference on Trade and Development, Handbook of Statistics and data files, and International Monetary Fund, International Financial Statistics.
Categories, topics:
Private Sector, Trade
Last updated:
apr 23, 2017
Indicators value changes by year
Meaning:
199.451
Minimum:
94.631
jan 1, 2002
Maximum:
346.047
jan 1, 2016
At the date of observation
Value
Absolute change
Change from the previous value
jan 1, 2001
100.0
+100.0
0.0%
jan 1, 2002
94.631
-5.369
-5.37%
jan 1, 2003
119.446
+24.815
26.22%
jan 1, 2004
123.904
+4.458
3.73%
jan 1, 2005
151.552
+27.648
22.31%
jan 1, 2006
181.814
+30.262
19.97%
jan 1, 2007
216.828
+35.014
19.26%
jan 1, 2008
191.996
-24.833
-11.45%
jan 1, 2009
270.912
+78.917
41.1%
jan 1, 2010
236.529
-34.383
-12.69%
jan 1, 2011
175.097
-61.432
-25.97%
jan 1, 2012
186.093
+10.996
6.28%
jan 1, 2013
238.84
+52.747
28.34%
jan 1, 2014
264.251
+25.411
10.64%
jan 1, 2015
293.273
+29.021
10.98%
jan 1, 2016
346.047
+52.774
17.99%
Ranking of countries by current statistics by years