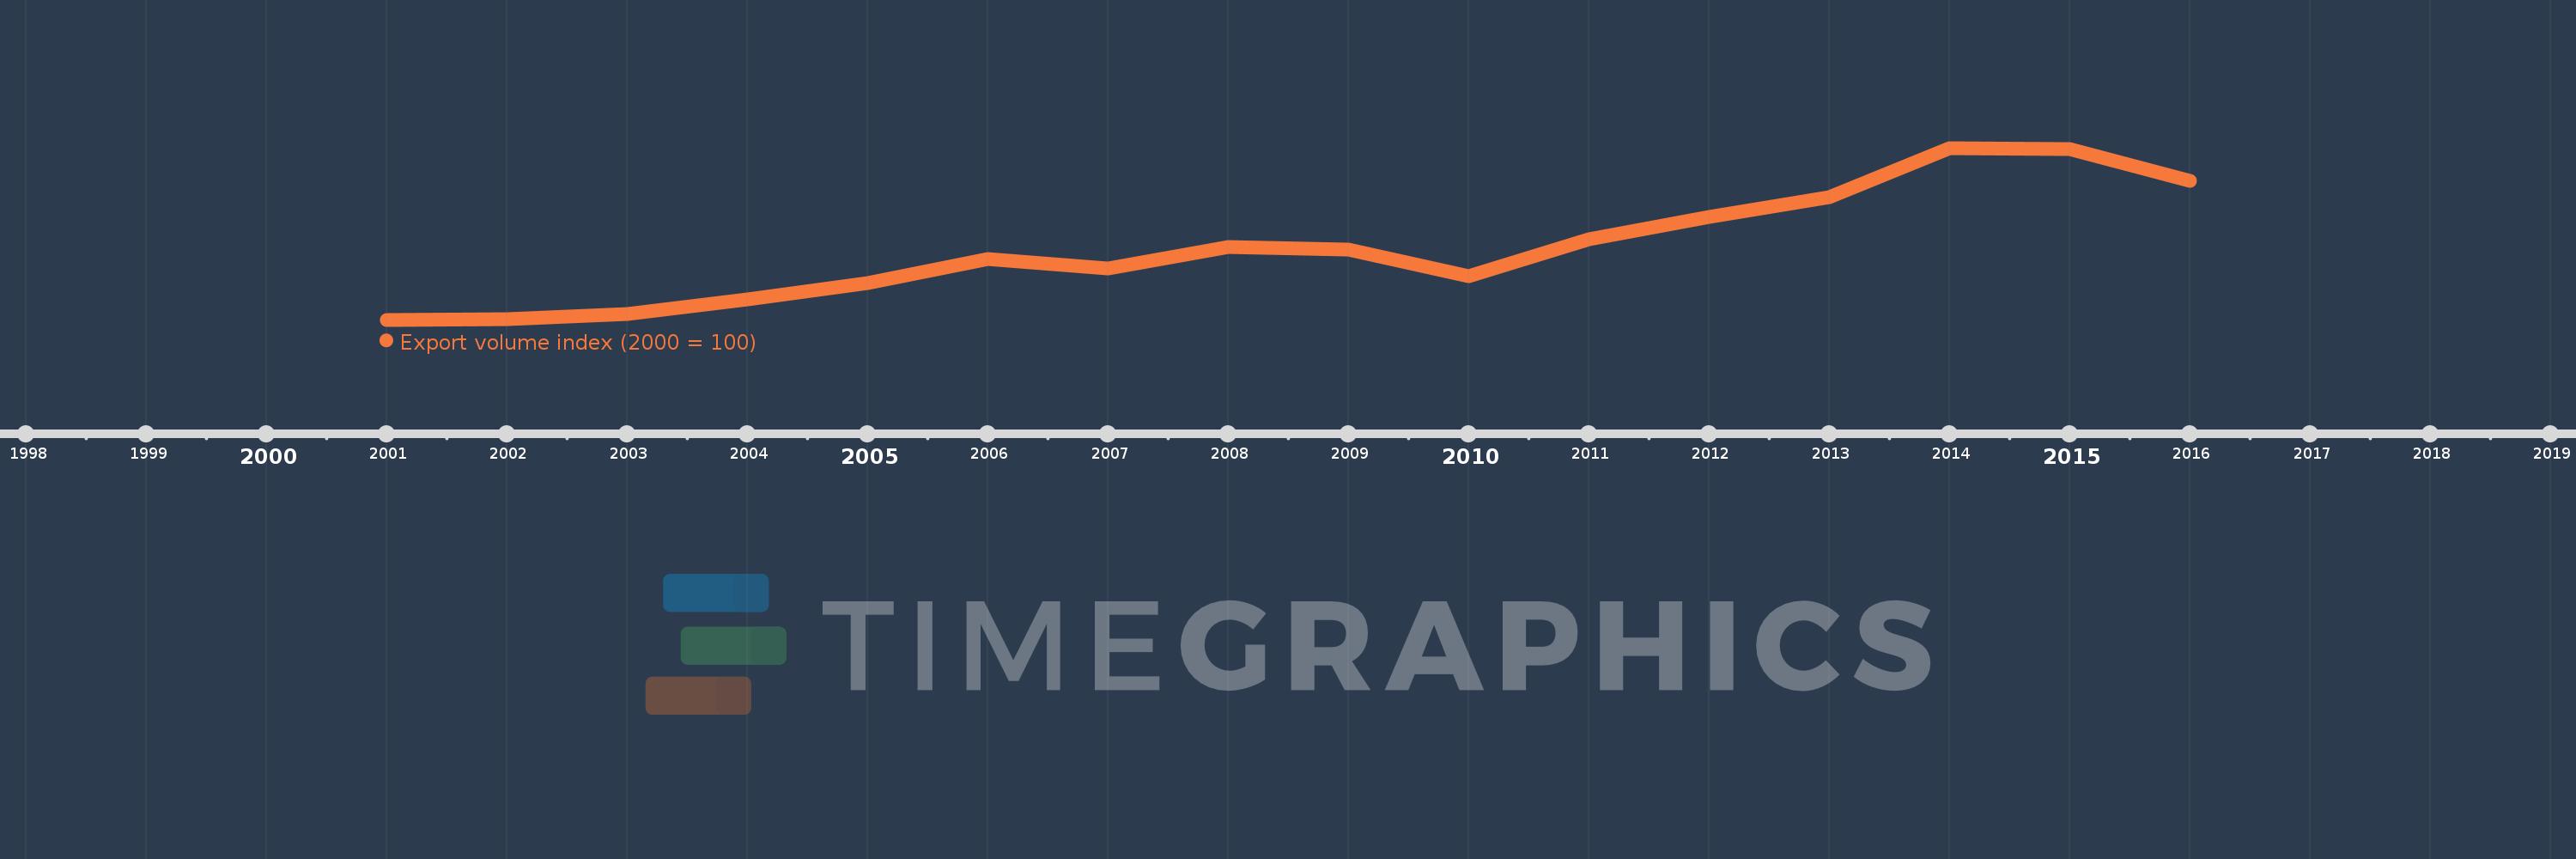
This timeline shows a graph from 2001 to 2016 of Georgia. No data until 2000. Number of actual observations by date: 16.
Source name:
World Development Indicators
Source organization:
United Nations Conference on Trade and Development, Handbook of Statistics and data files, and International Monetary Fund, International Financial Statistics.
Categories, topics:
Private Sector, Trade
Last updated:
apr 23, 2017
Indicators value changes by year
Meaning:
216.714
Minimum:
100.0
jan 1, 2001
Maximum:
379.191
jan 1, 2014
At the date of observation
Value
Absolute change
Change from the previous value
jan 1, 2001
100.0
+100.0
0.0%
jan 1, 2002
101.361
+1.361
1.36%
jan 1, 2003
109.7
+8.339
8.23%
jan 1, 2004
133.336
+23.636
21.55%
jan 1, 2005
159.544
+26.209
19.66%
jan 1, 2006
198.604
+39.06
24.48%
jan 1, 2007
182.671
-15.934
-8.02%
jan 1, 2008
218.089
+35.418
19.39%
jan 1, 2009
214.323
-3.766
-1.73%
jan 1, 2010
171.425
-42.898
-20.02%
jan 1, 2011
230.623
+59.198
34.53%
jan 1, 2012
266.879
+36.256
15.72%
jan 1, 2013
298.505
+31.627
11.85%
jan 1, 2014
379.191
+80.685
27.03%
jan 1, 2015
377.271
-1.919
-0.51%
jan 1, 2016
325.897
-51.374
-13.62%
Ranking of countries by current statistics by years