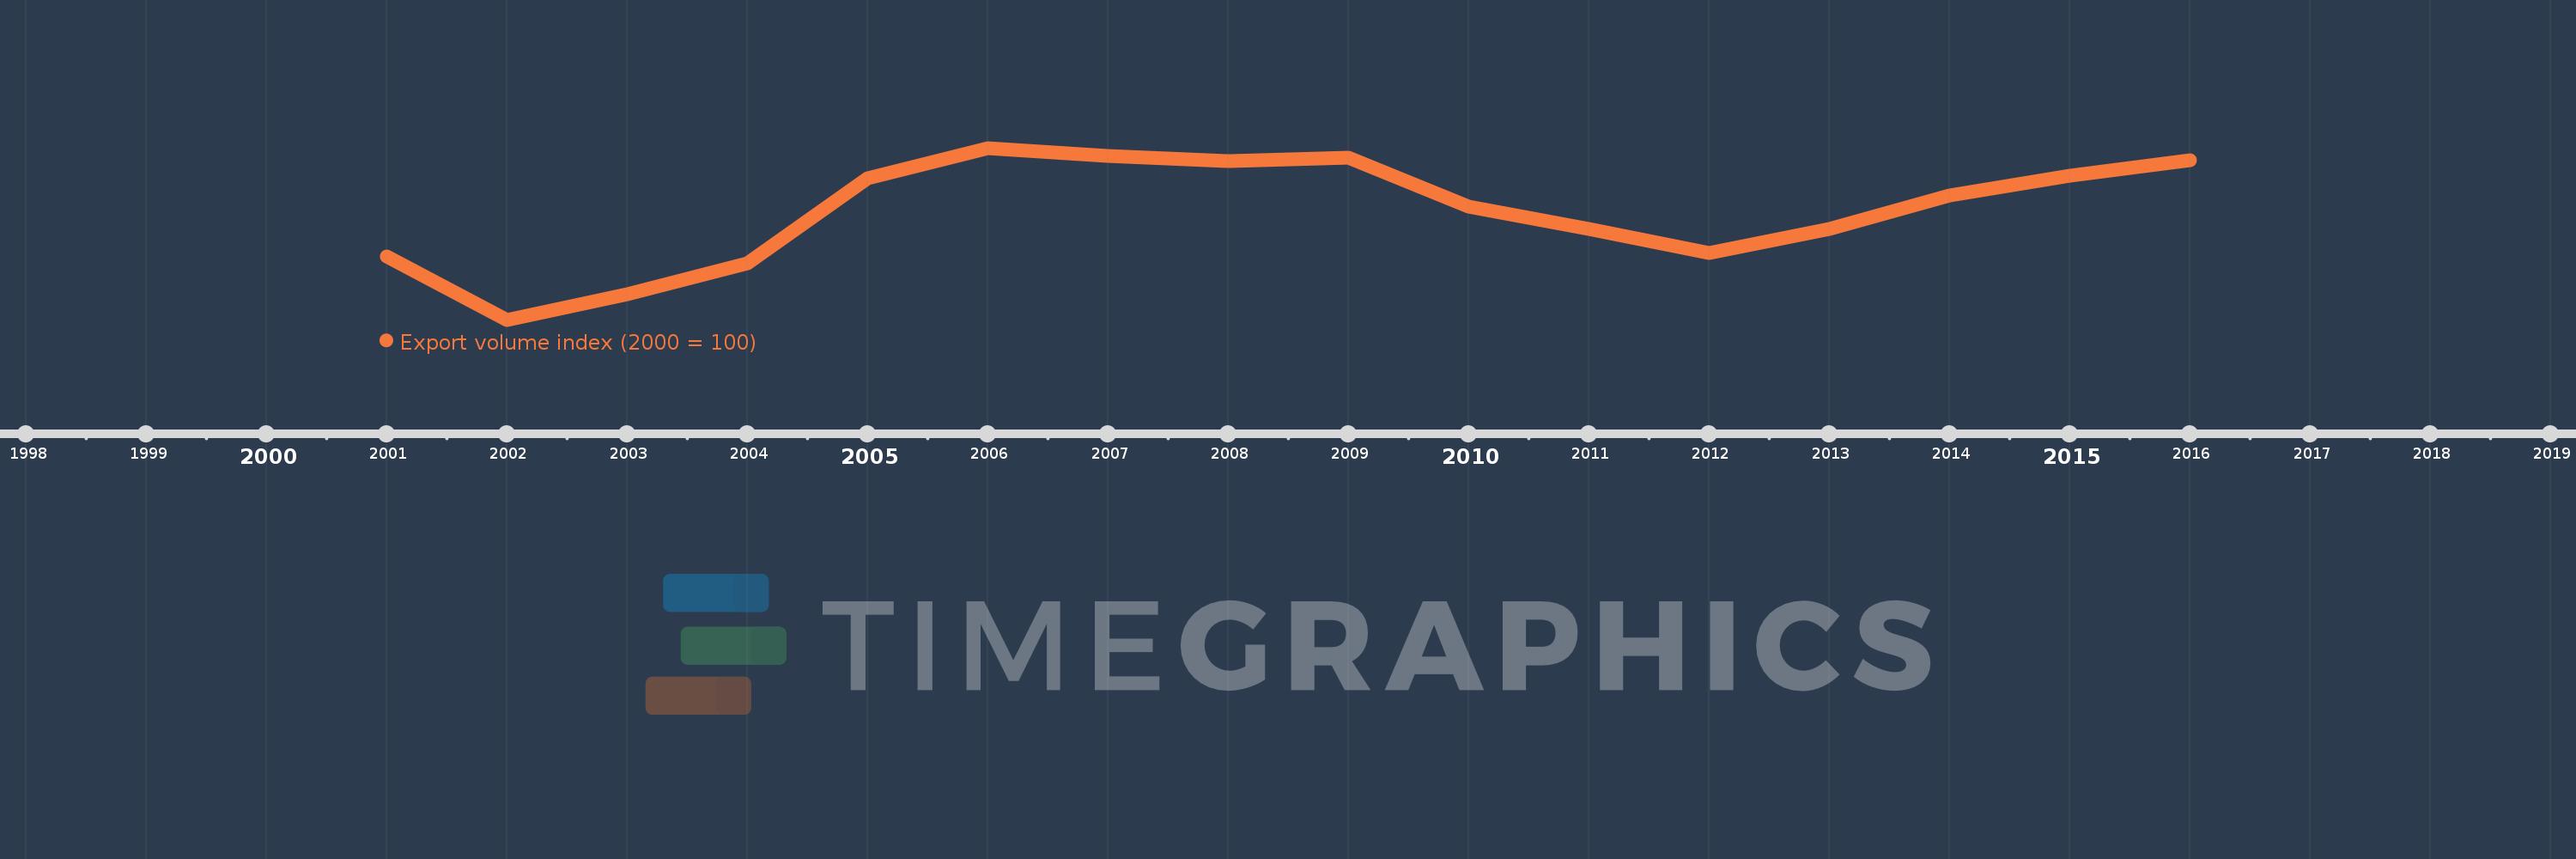
This timeline shows a graph from 2001 to 2016 of Afghanistan. No data until 2000. Number of actual observations by date: 16.
Source name:
World Development Indicators
Source organization:
United Nations Conference on Trade and Development, Handbook of Statistics and data files, and International Monetary Fund, International Financial Statistics.
Categories, topics:
Private Sector, Trade
Last updated:
apr 23, 2017
Indicators value changes by year
Meaning:
139.885
Minimum:
44.565
jan 1, 2002
Maximum:
195.668
jan 1, 2006
At the date of observation
Value
Absolute change
Change from the previous value
jan 1, 2001
100.0
+100.0
0.0%
jan 1, 2002
44.565
-55.435
-55.43%
jan 1, 2003
67.213
+22.648
50.82%
jan 1, 2004
94.198
+26.984
40.15%
jan 1, 2005
169.174
+74.977
79.59%
jan 1, 2006
195.668
+26.494
15.66%
jan 1, 2007
188.693
-6.975
-3.56%
jan 1, 2008
184.468
-4.225
-2.24%
jan 1, 2009
187.364
+2.896
1.57%
jan 1, 2010
144.326
-43.038
-22.97%
jan 1, 2011
124.299
-20.027
-13.88%
jan 1, 2012
103.463
-20.836
-16.76%
jan 1, 2013
124.564
+21.1
20.39%
jan 1, 2014
154.119
+29.555
23.73%
jan 1, 2015
171.046
+16.927
10.98%
jan 1, 2016
184.999
+13.953
8.16%
Ranking of countries by current statistics by years