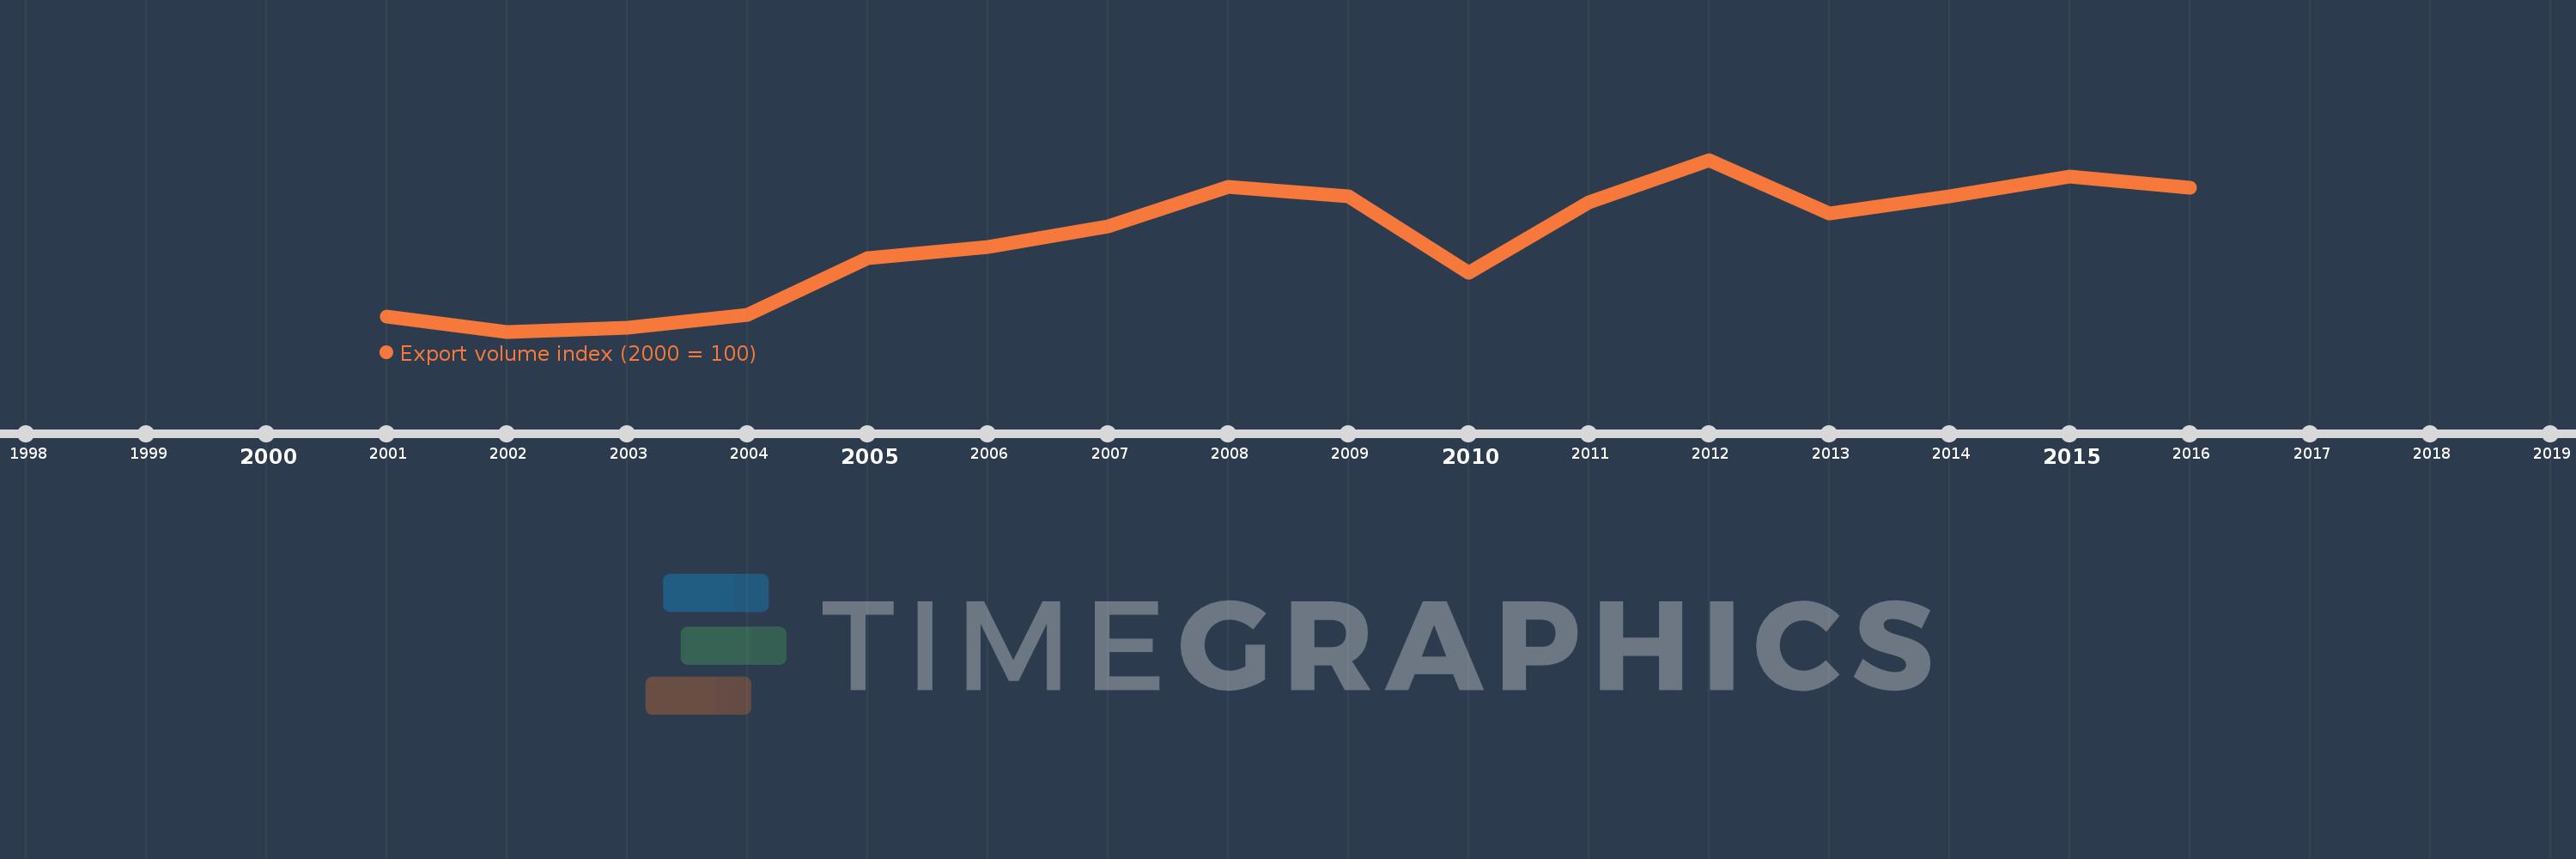
This timeline shows a graph from 2001 to 2016 of Israel. No data until 2000. Number of actual observations by date: 16.
Source name:
World Development Indicators
Source organization:
United Nations Conference on Trade and Development, Handbook of Statistics and data files, and International Monetary Fund, International Financial Statistics.
Categories, topics:
Private Sector, Trade
Last updated:
apr 23, 2017
Indicators value changes by year
Meaning:
121.59
Minimum:
95.922
jan 1, 2002
Maximum:
143.267
jan 1, 2012
At the date of observation
Value
Absolute change
Change from the previous value
jan 1, 2001
100.0
+100.0
0.0%
jan 1, 2002
95.922
-4.078
-4.08%
jan 1, 2003
96.979
+1.057
1.1%
jan 1, 2004
100.557
+3.578
3.69%
jan 1, 2005
116.175
+15.618
15.53%
jan 1, 2006
119.122
+2.947
2.54%
jan 1, 2007
124.825
+5.703
4.79%
jan 1, 2008
135.886
+11.061
8.86%
jan 1, 2009
133.294
-2.592
-1.91%
jan 1, 2010
112.061
-21.233
-15.93%
jan 1, 2011
131.519
+19.458
17.36%
jan 1, 2012
143.267
+11.749
8.93%
jan 1, 2013
128.372
-14.895
-10.4%
jan 1, 2014
133.091
+4.719
3.68%
jan 1, 2015
138.681
+5.59
4.2%
jan 1, 2016
135.683
-2.998
-2.16%
Ranking of countries by current statistics by years