30
/
AIzaSyAYiBZKx7MnpbEhh9jyipgxe19OcubqV5w
April 1, 2024
270451
Turkmenistan
TKM
true
2
1
Export volume index (2000 = 100)
2016,2015,2014,2013,2012,2011,2010,2009,2008,2007,2006,2005,2004,2003,2002,2001
Download
Global statistics library →Turkmenistan →

Export volume index (2000 = 100)

This statistics in other country:

AfghanistanAlbaniaAlgeriaAmerican SamoaAndorraAngolaAntigua and BarbudaArgentinaArmeniaArubaAustraliaAustriaAzerbaijanBahamas, TheBahrainBangladeshBarbadosBelarusBelgiumBelizeBeninBermudaBhutanBoliviaBosnia and HerzegovinaBotswanaBrazilBritish Virgin IslandsBrunei DarussalamBulgariaBurkina FasoBurundiCabo VerdeCambodiaCameroonCanadaCayman IslandsCentral African RepublicChadChileChinaColombiaComorosCongo, Dem. Rep.Congo, Rep.Costa RicaCote d'IvoireCroatiaCubaCuracaoCyprusCzech RepublicDenmarkDjiboutiDominicaDominican RepublicEcuadorEgypt, Arab Rep.El SalvadorEquatorial GuineaEritreaEstoniaEthiopiaFaroe IslandsFijiFinlandFranceFrench PolynesiaGabonGambia, TheGeorgiaGermanyGhanaGibraltarGreeceGreenlandGrenadaGuamGuatemalaGuineaGuinea-BissauGuyanaHaitiHondurasHong Kong SAR, ChinaHungaryIcelandIndiaIndonesiaIran, Islamic Rep.IraqIrelandIsraelItalyJamaicaJapanJordanKazakhstanKenyaKiribatiKorea, Dem. People’s Rep.Korea, Rep.KuwaitKyrgyz RepublicLao PDRLatviaLebanonLesothoLiberiaLibyaLithuaniaLuxembourgMacao SAR, ChinaMacedonia, FYRMadagascarMalawiMalaysiaMaldivesMaliMaltaMarshall IslandsMauritaniaMauritiusMexicoMicronesia, Fed. Sts.MoldovaMongoliaMoroccoMozambiqueMyanmarNamibiaNauruNepalNetherlandsNew CaledoniaNew ZealandNicaraguaNigerNigeriaNorthern Mariana IslandsNorwayOmanPakistanPalauPanamaPapua New GuineaParaguayPeruPhilippinesPolandPortugalQatarRomaniaRussian FederationRwandaSamoaSao Tome and PrincipeSaudi ArabiaSenegalSerbiaSeychellesSierra LeoneSingaporeSlovak RepublicSloveniaSolomon IslandsSomaliaSouth AfricaSpainSri LankaSt. Kitts and NevisSt. LuciaSt. Vincent and the GrenadinesSudanSurinameSwazilandSwedenSwitzerlandSyrian Arab RepublicTajikistanTanzaniaThailandTogoTongaTrinidad and TobagoTunisiaTurkeyTurkmenistanTurks and Caicos IslandsUgandaUkraineUnited Arab EmiratesUnited KingdomUnited StatesUruguayUzbekistanVanuatuVenezuela, RBVietnamWest Bank and GazaYemen, Rep.ZambiaZimbabwe

Timeline:

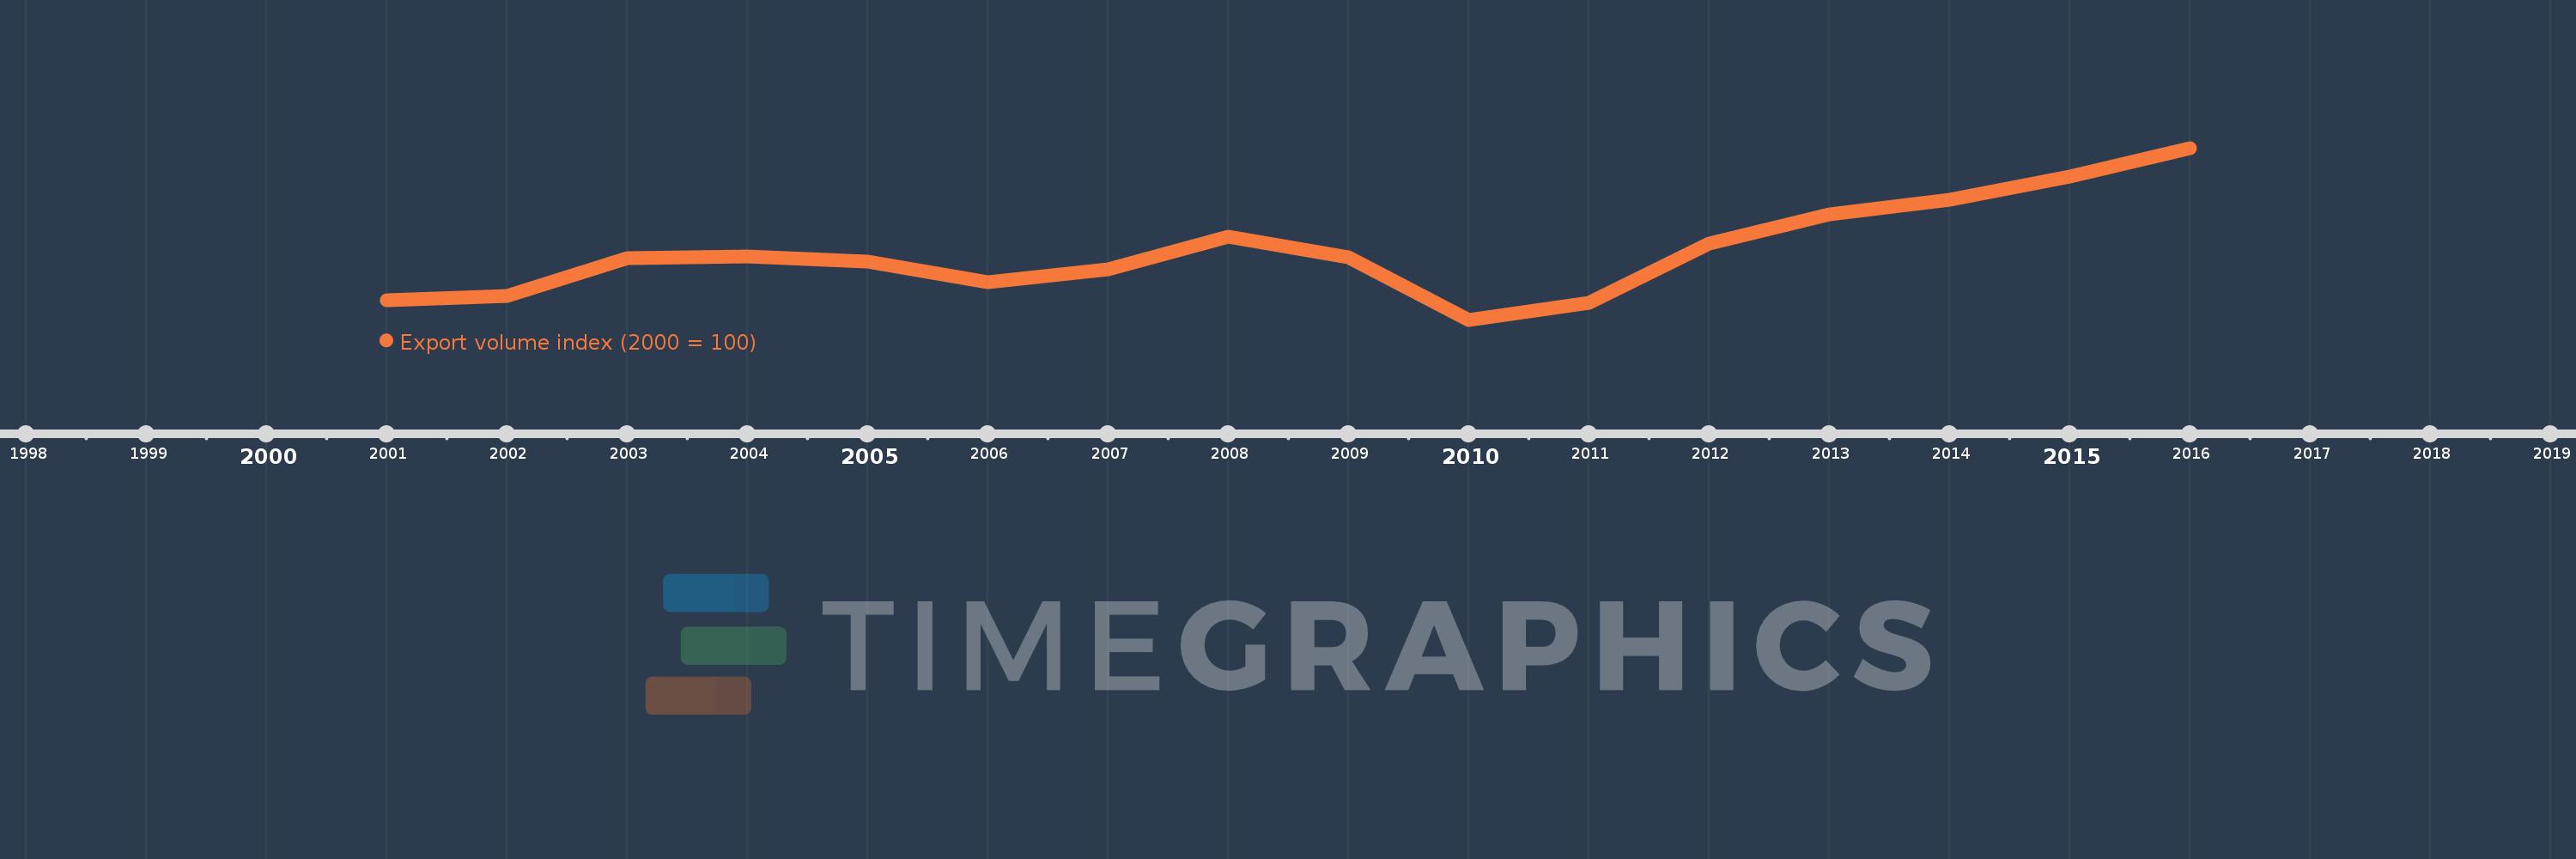
This timeline shows a graph from 2001 to 2016 of Turkmenistan. No data until 2000. Number of actual observations by date: 16.

Source name:

World Development Indicators

Source organization:

United Nations Conference on Trade and Development, Handbook of Statistics and data files, and International Monetary Fund, International Financial Statistics.

Categories, topics:

Private Sector, Trade

Last updated:

apr 23, 2017

Indicators value changes by year

Meaning:
143.197
Minimum:
82.306
jan 1, 2010
Maximum:
235.462
jan 1, 2016
At the date of observation
Value
Absolute change
Change from the previous value
jan 1, 2001
100.0
+100.0
0.0%
jan 1, 2002
103.262
+3.262
3.26%
jan 1, 2003
137.479
+34.217
33.14%
jan 1, 2004
138.914
+1.435
1.04%
jan 1, 2005
134.162
-4.752
-3.42%
jan 1, 2006
115.411
-18.751
-13.98%
jan 1, 2007
127.156
+11.746
10.18%
jan 1, 2008
156.078
+28.922
22.75%
jan 1, 2009
137.767
-18.311
-11.73%
jan 1, 2010
82.306
-55.461
-40.26%
jan 1, 2011
97.664
+15.358
18.66%
jan 1, 2012
150.252
+52.588
53.85%
jan 1, 2013
175.952
+25.699
17.1%
jan 1, 2014
189.477
+13.526
7.69%
jan 1, 2015
209.815
+20.338
10.73%
jan 1, 2016
235.462
+25.647
12.22%

Ranking of countries by current statistics by years