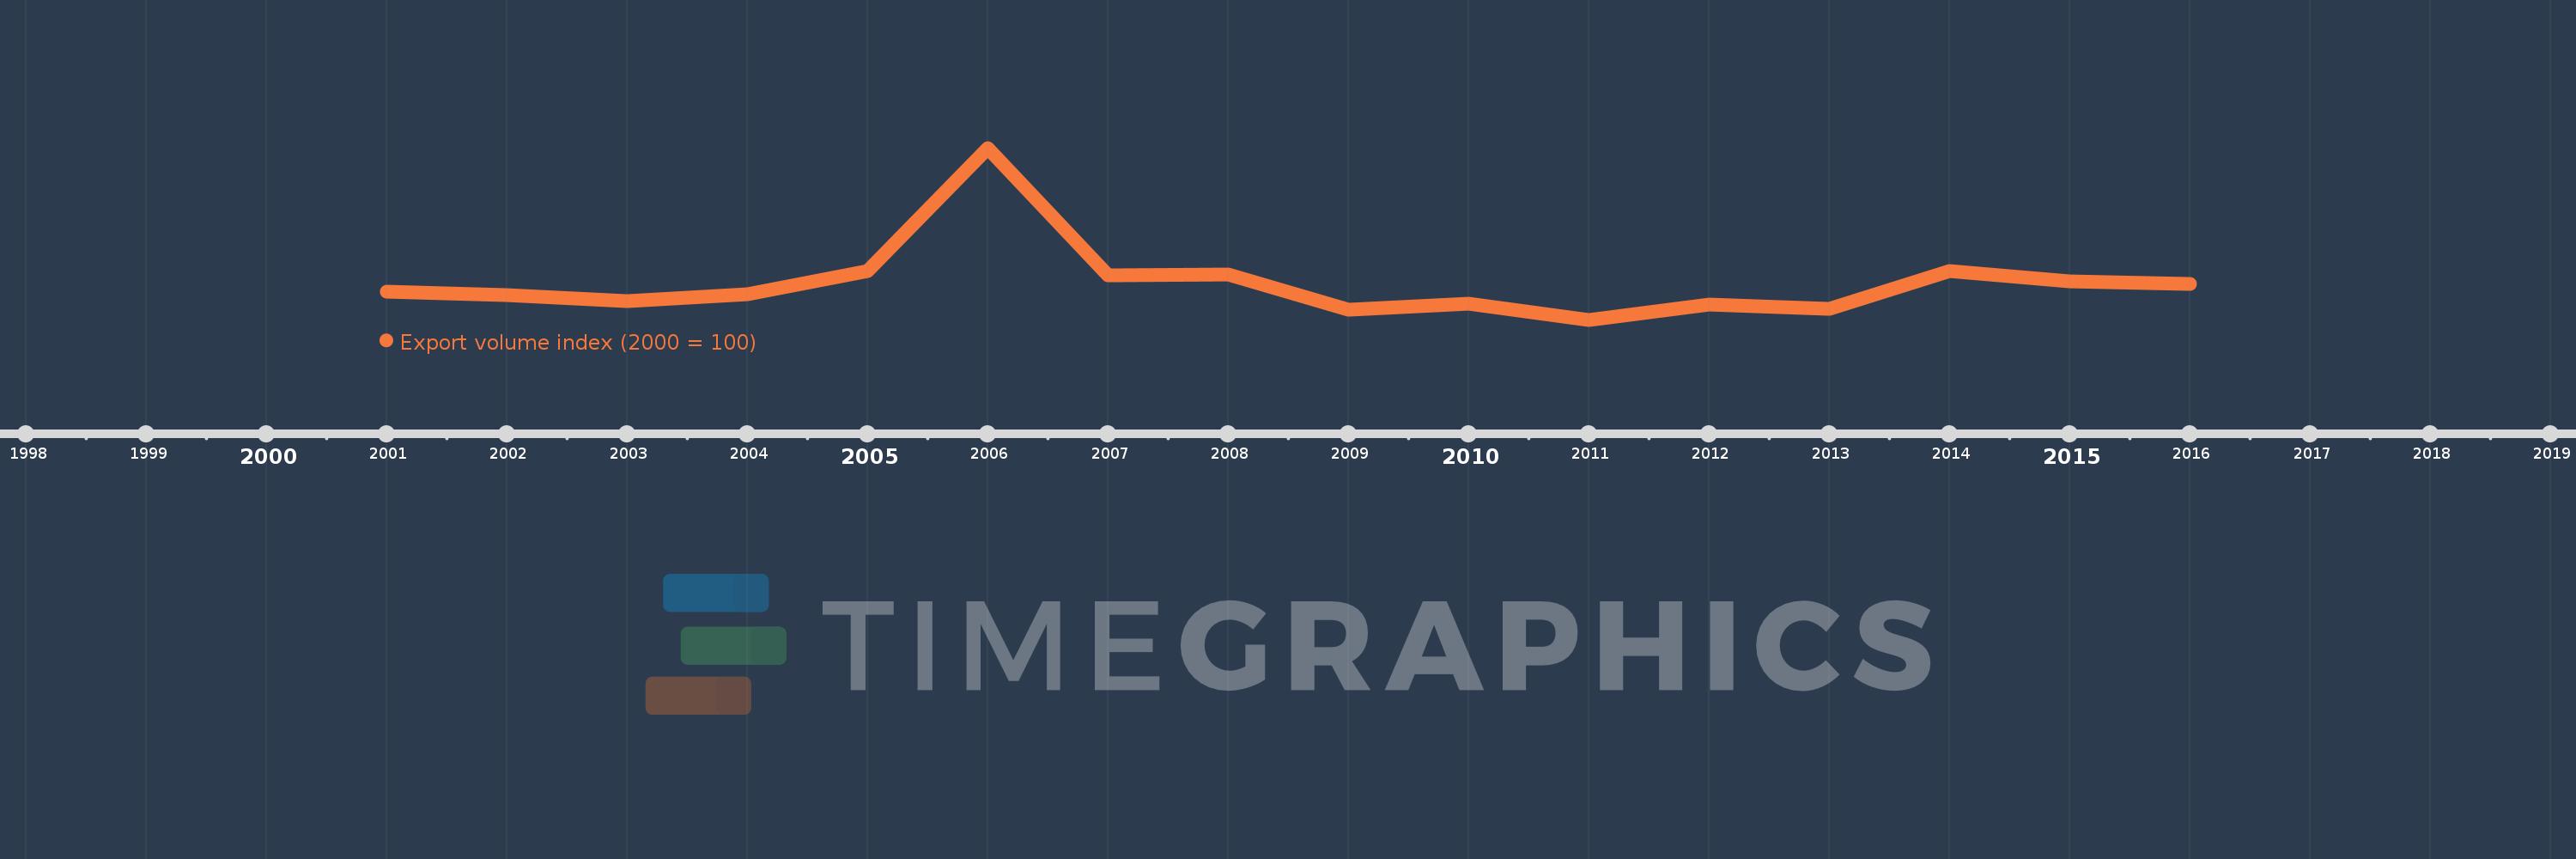
This timeline shows a graph from 2001 to 2016 of Cayman Islands. No data until 2000. Number of actual observations by date: 16.
Source name:
World Development Indicators
Source organization:
United Nations Conference on Trade and Development, Handbook of Statistics and data files, and International Monetary Fund, International Financial Statistics.
Categories, topics:
Private Sector, Trade
Last updated:
apr 23, 2017
Indicators value changes by year
Meaning:
114.469
Minimum:
48.261
jan 1, 2011
Maximum:
360.813
jan 1, 2006
At the date of observation
Value
Absolute change
Change from the previous value
jan 1, 2001
100.0
+100.0
0.0%
jan 1, 2002
92.884
-7.116
-7.12%
jan 1, 2003
81.431
-11.454
-12.33%
jan 1, 2004
94.171
+12.74
15.65%
jan 1, 2005
137.164
+42.993
45.65%
jan 1, 2006
360.813
+223.649
163.05%
jan 1, 2007
129.016
-231.797
-64.24%
jan 1, 2008
131.08
+2.064
1.6%
jan 1, 2009
66.392
-64.687
-49.35%
jan 1, 2010
77.997
+11.604
17.48%
jan 1, 2011
48.261
-29.736
-38.12%
jan 1, 2012
75.775
+27.514
57.01%
jan 1, 2013
68.161
-7.614
-10.05%
jan 1, 2014
136.395
+68.234
100.11%
jan 1, 2015
118.674
-17.72
-12.99%
jan 1, 2016
113.295
-5.379
-4.53%
Ranking of countries by current statistics by years