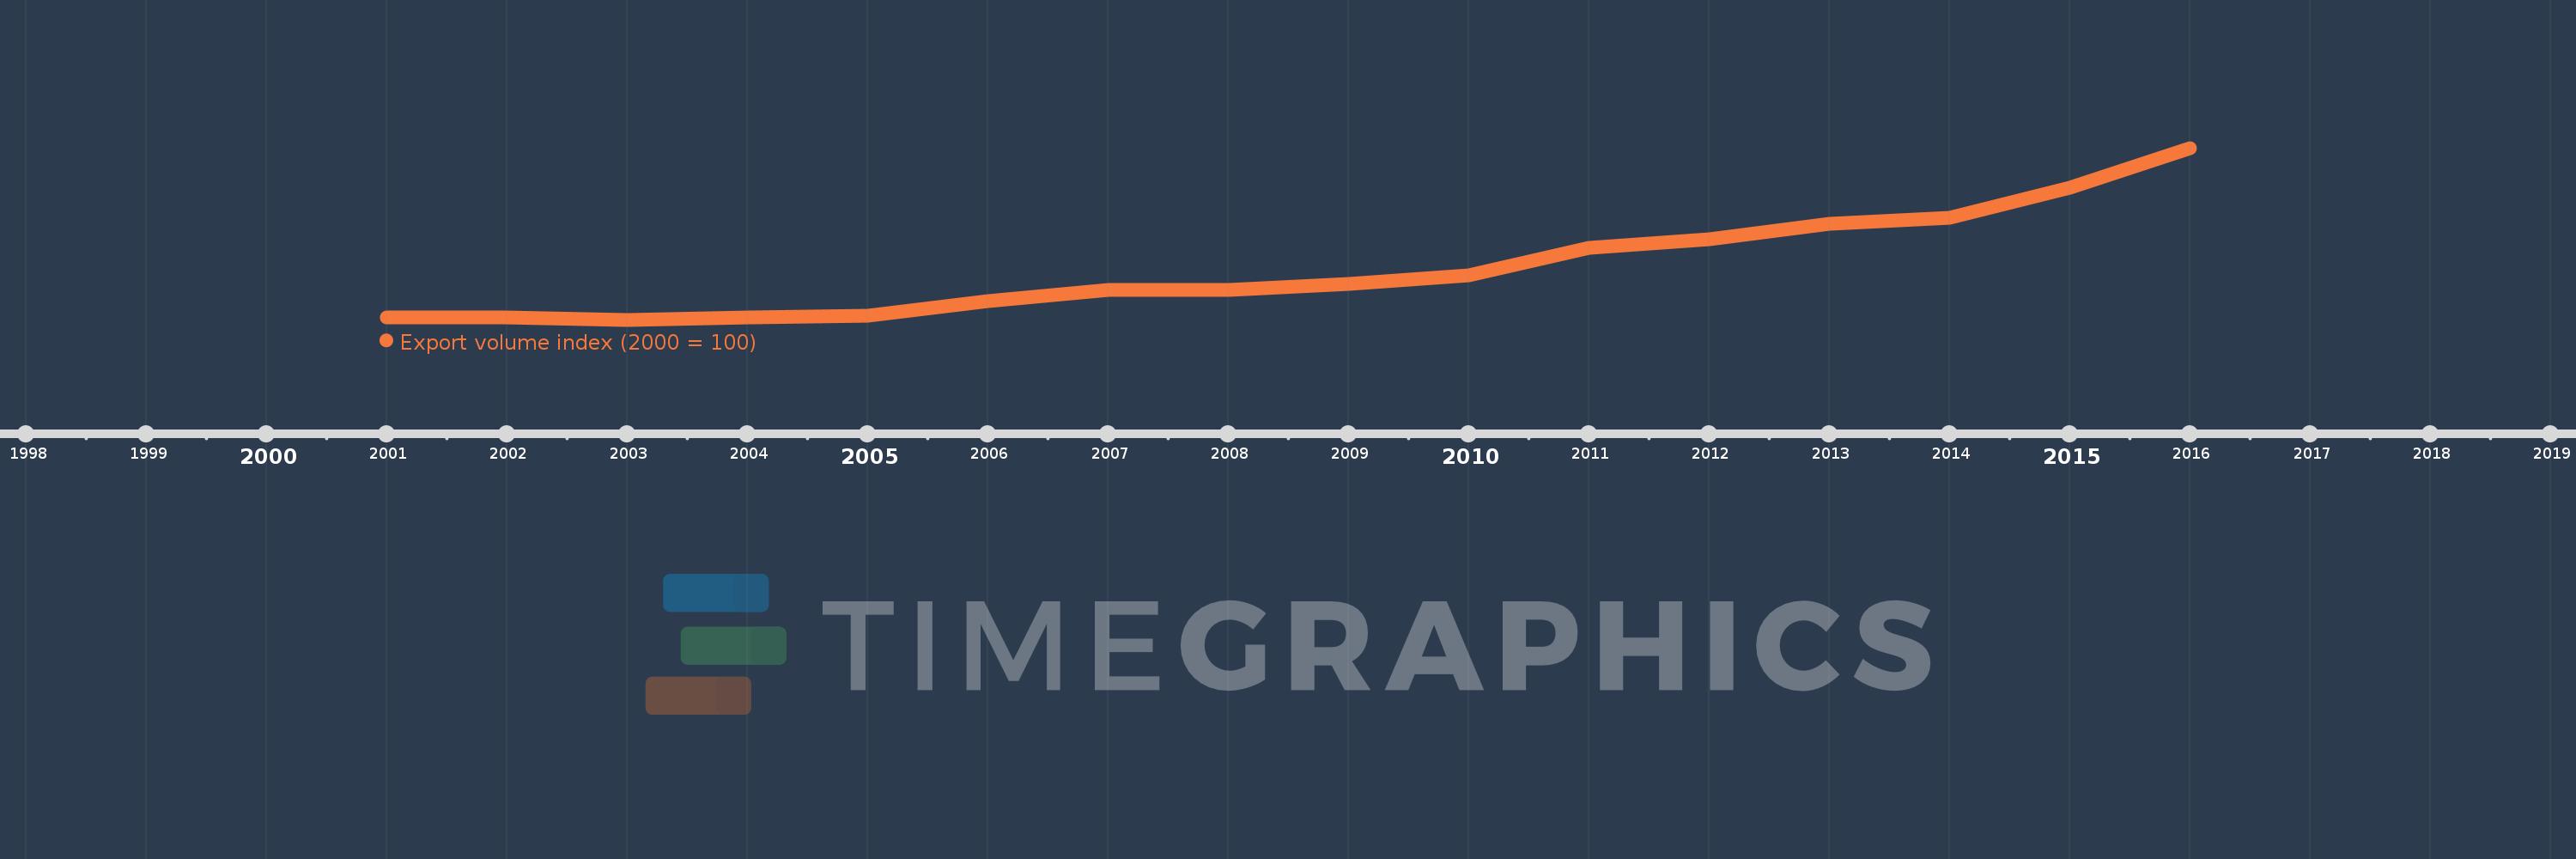
This timeline shows a graph from 2001 to 2016 of Lao PDR. No data until 2000. Number of actual observations by date: 16.
Source name:
World Development Indicators
Source organization:
United Nations Conference on Trade and Development, Handbook of Statistics and data files, and International Monetary Fund, International Financial Statistics.
Categories, topics:
Private Sector, Trade
Last updated:
apr 23, 2017
Indicators value changes by year
Meaning:
225.135
Minimum:
93.219
jan 1, 2003
Maximum:
533.658
jan 1, 2016
At the date of observation
Value
Absolute change
Change from the previous value
jan 1, 2001
100.0
+100.0
0.0%
jan 1, 2002
98.771
-1.229
-1.23%
jan 1, 2003
93.219
-5.552
-5.62%
jan 1, 2004
98.912
+5.694
6.11%
jan 1, 2005
102.496
+3.584
3.62%
jan 1, 2006
141.409
+38.913
37.97%
jan 1, 2007
169.444
+28.035
19.83%
jan 1, 2008
170.632
+1.188
0.7%
jan 1, 2009
184.476
+13.845
8.11%
jan 1, 2010
207.6
+23.123
12.53%
jan 1, 2011
276.819
+69.219
33.34%
jan 1, 2012
299.107
+22.288
8.05%
jan 1, 2013
339.081
+39.974
13.36%
jan 1, 2014
354.189
+15.108
4.46%
jan 1, 2015
432.351
+78.163
22.07%
jan 1, 2016
533.658
+101.307
23.43%
Ranking of countries by current statistics by years