33
/
AIzaSyAYiBZKx7MnpbEhh9jyipgxe19OcubqV5w
August 1, 2025
227359
Qatar
QAT
true
2
1
Export volume index (2000 = 100)
2016,2015,2014,2013,2012,2011,2010,2009,2008,2007,2006,2005,2004,2003,2002,2001,1986,1985,1984,1983,1982,1981
Download
Global statistics library →Qatar →

Export volume index (2000 = 100)

This statistics in other country:

AfghanistanAlbaniaAlgeriaAmerican SamoaAndorraAngolaAntigua and BarbudaArgentinaArmeniaArubaAustraliaAustriaAzerbaijanBahamas, TheBahrainBangladeshBarbadosBelarusBelgiumBelizeBeninBermudaBhutanBoliviaBosnia and HerzegovinaBotswanaBrazilBritish Virgin IslandsBrunei DarussalamBulgariaBurkina FasoBurundiCabo VerdeCambodiaCameroonCanadaCayman IslandsCentral African RepublicChadChileChinaColombiaComorosCongo, Dem. Rep.Congo, Rep.Costa RicaCote d'IvoireCroatiaCubaCuracaoCyprusCzech RepublicDenmarkDjiboutiDominicaDominican RepublicEcuadorEgypt, Arab Rep.El SalvadorEquatorial GuineaEritreaEstoniaEthiopiaFaroe IslandsFijiFinlandFranceFrench PolynesiaGabonGambia, TheGeorgiaGermanyGhanaGibraltarGreeceGreenlandGrenadaGuamGuatemalaGuineaGuinea-BissauGuyanaHaitiHondurasHong Kong SAR, ChinaHungaryIcelandIndiaIndonesiaIran, Islamic Rep.IraqIrelandIsraelItalyJamaicaJapanJordanKazakhstanKenyaKiribatiKorea, Dem. People’s Rep.Korea, Rep.KuwaitKyrgyz RepublicLao PDRLatviaLebanonLesothoLiberiaLibyaLithuaniaLuxembourgMacao SAR, ChinaMacedonia, FYRMadagascarMalawiMalaysiaMaldivesMaliMaltaMarshall IslandsMauritaniaMauritiusMexicoMicronesia, Fed. Sts.MoldovaMongoliaMoroccoMozambiqueMyanmarNamibiaNauruNepalNetherlandsNew CaledoniaNew ZealandNicaraguaNigerNigeriaNorthern Mariana IslandsNorwayOmanPakistanPalauPanamaPapua New GuineaParaguayPeruPhilippinesPolandPortugalQatarRomaniaRussian FederationRwandaSamoaSao Tome and PrincipeSaudi ArabiaSenegalSerbiaSeychellesSierra LeoneSingaporeSlovak RepublicSloveniaSolomon IslandsSomaliaSouth AfricaSpainSri LankaSt. Kitts and NevisSt. LuciaSt. Vincent and the GrenadinesSudanSurinameSwazilandSwedenSwitzerlandSyrian Arab RepublicTajikistanTanzaniaThailandTogoTongaTrinidad and TobagoTunisiaTurkeyTurkmenistanTurks and Caicos IslandsUgandaUkraineUnited Arab EmiratesUnited KingdomUnited StatesUruguayUzbekistanVanuatuVenezuela, RBVietnamWest Bank and GazaYemen, Rep.ZambiaZimbabwe

Timeline:

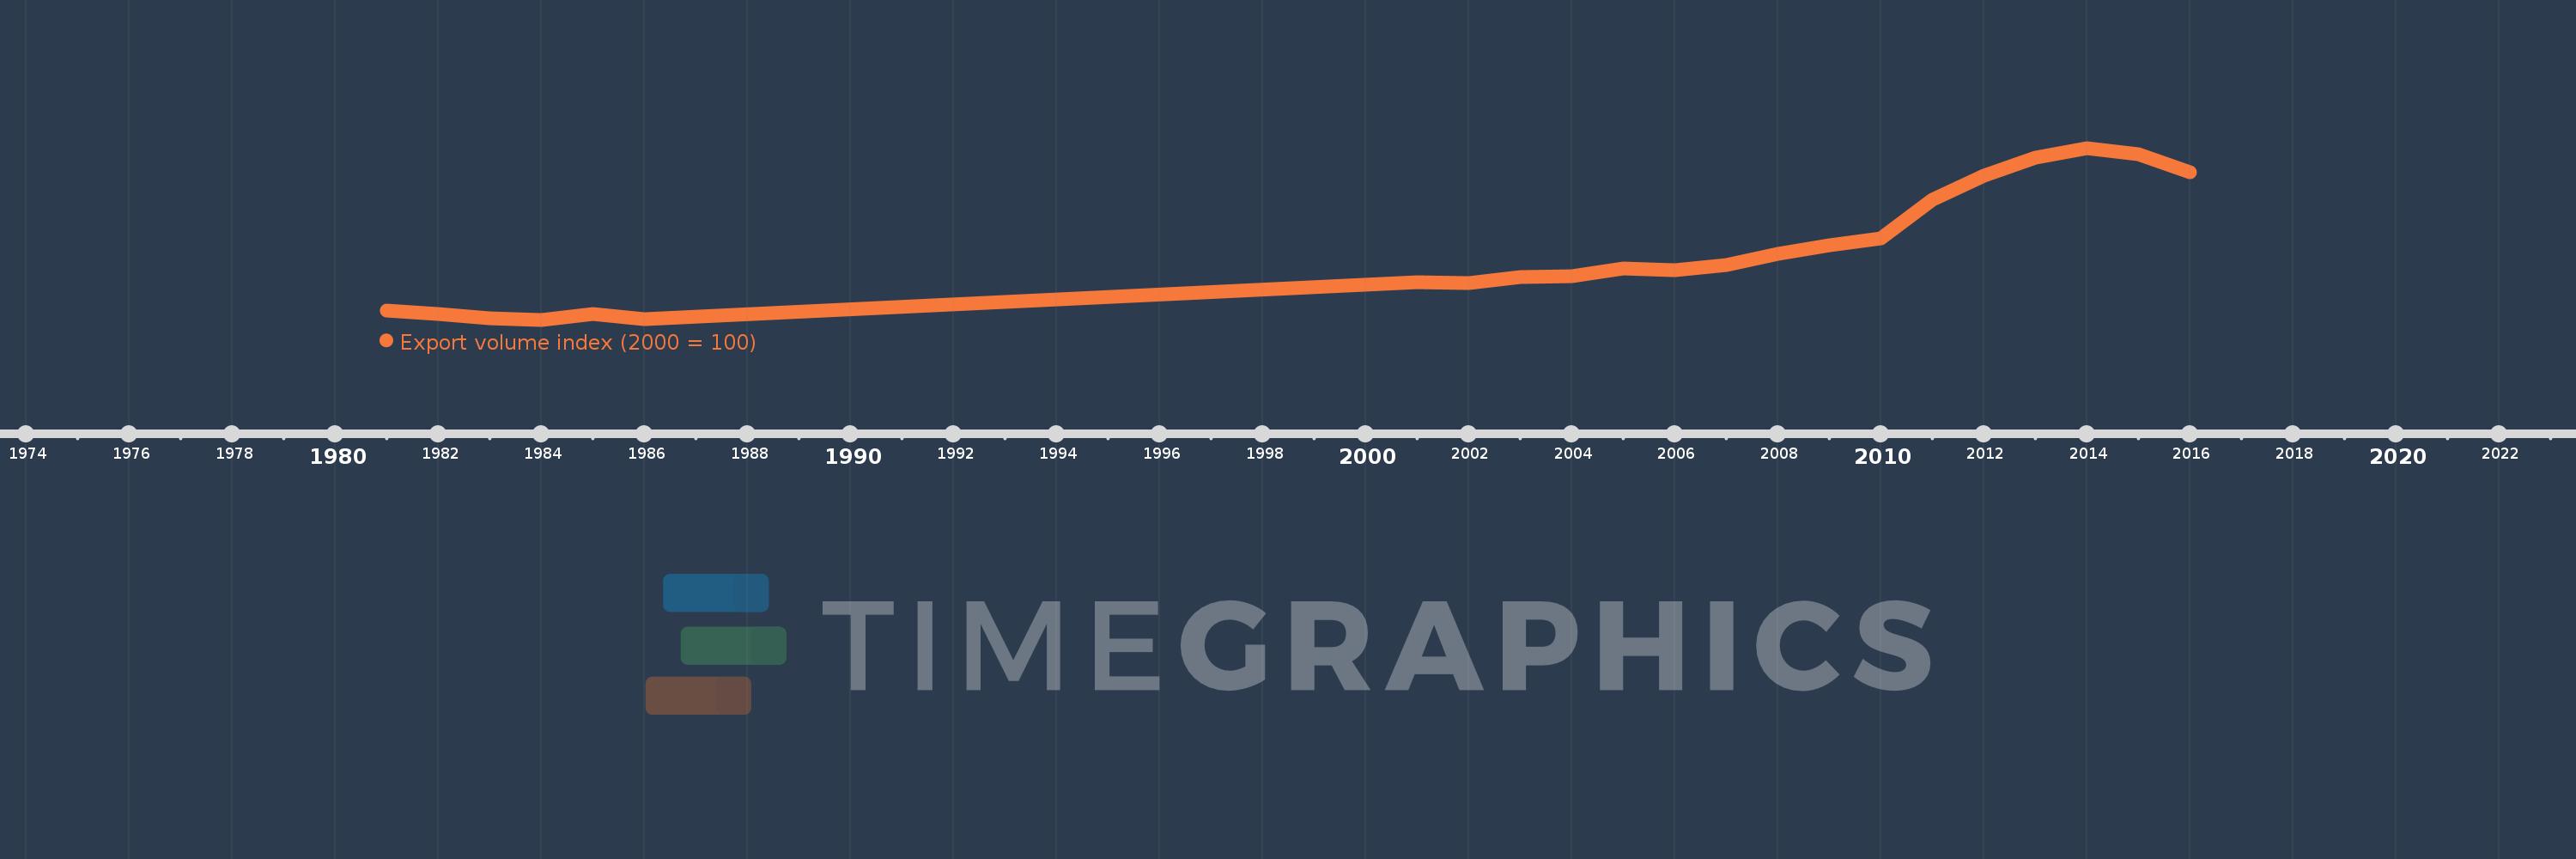
This timeline shows a graph from 1981 to 2016 of Qatar. No data until 1980. Number of actual observations by date: 22.

Source name:

World Development Indicators

Source organization:

United Nations Conference on Trade and Development, Handbook of Statistics and data files, and International Monetary Fund, International Financial Statistics.

Categories, topics:

Private Sector, Trade

Last updated:

apr 23, 2017

Indicators value changes by year

Meaning:
154.685
Minimum:
28.648
jan 1, 1984
Maximum:
352.136
jan 1, 2014
At the date of observation
Value
Absolute change
Change from the previous value
jan 1, 1981
45.772
+45.772
0.0%
jan 1, 1982
39.171
-6.602
-14.42%
jan 1, 1983
32.0
-7.17
-18.3%
jan 1, 1984
28.648
-3.352
-10.48%
jan 1, 1985
39.168
+10.52
36.72%
jan 1, 1986
29.928
-9.24
-23.59%
jan 1, 2001
100.0
+70.072
234.13%
jan 1, 2002
98.158
-1.842
-1.84%
jan 1, 2003
109.216
+11.058
11.27%
jan 1, 2004
110.673
+1.456
1.33%
jan 1, 2005
125.992
+15.32
13.84%
jan 1, 2006
122.247
-3.745
-2.97%
jan 1, 2007
131.575
+9.327
7.63%
jan 1, 2008
152.525
+20.95
15.92%
jan 1, 2009
169.133
+16.608
10.89%
jan 1, 2010
181.075
+11.942
7.06%
jan 1, 2011
255.402
+74.327
41.05%
jan 1, 2012
300.686
+45.283
17.73%
jan 1, 2013
333.821
+33.135
11.02%
jan 1, 2014
352.136
+18.315
5.49%
jan 1, 2015
339.736
-12.399
-3.52%
jan 1, 2016
306.005
-33.731
-9.93%

Ranking of countries by current statistics by years