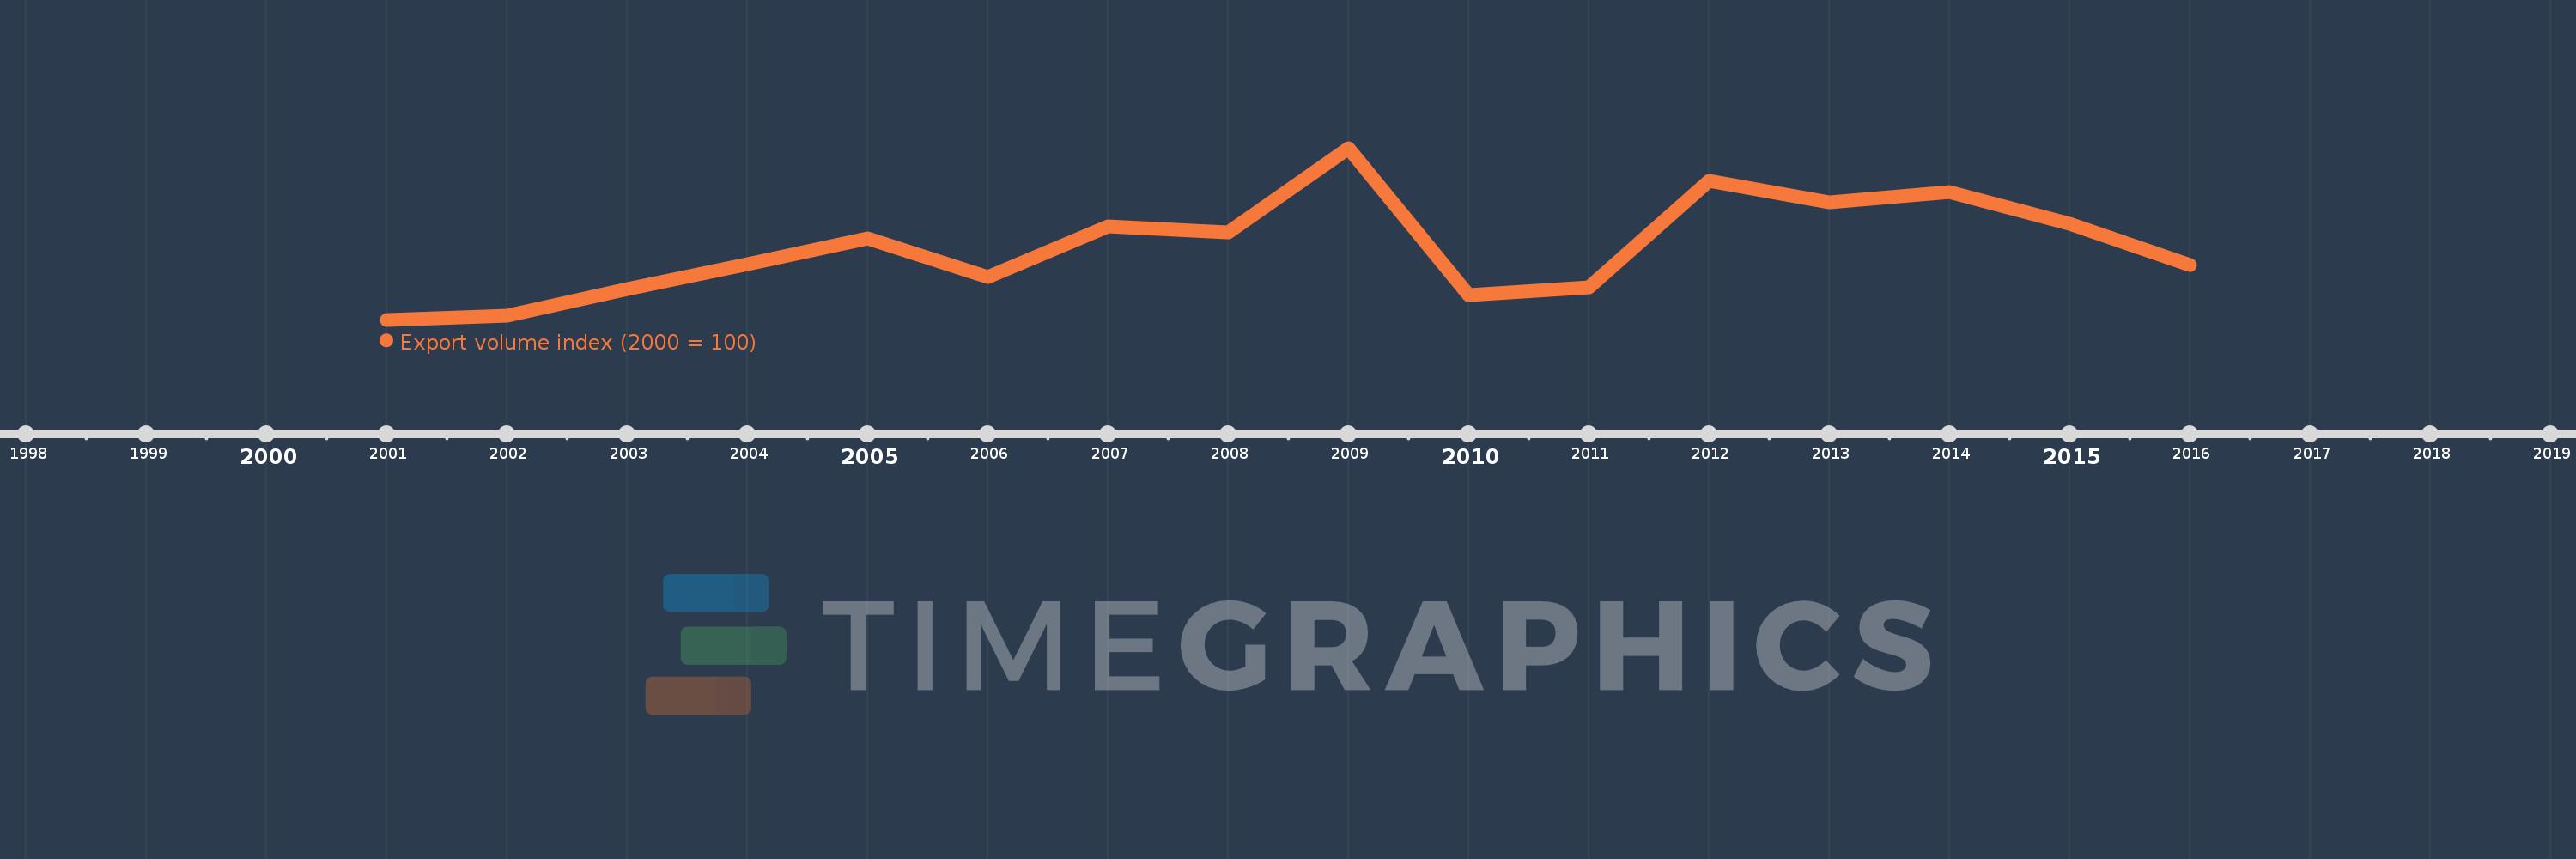
This timeline shows a graph from 2001 to 2016 of Maldives. No data until 2000. Number of actual observations by date: 16.
Source name:
World Development Indicators
Source organization:
United Nations Conference on Trade and Development, Handbook of Statistics and data files, and International Monetary Fund, International Financial Statistics.
Categories, topics:
Private Sector, Trade
Last updated:
apr 23, 2017
Indicators value changes by year
Meaning:
153.218
Minimum:
100.0
jan 1, 2001
Maximum:
226.073
jan 1, 2009
At the date of observation
Value
Absolute change
Change from the previous value
jan 1, 2001
100.0
+100.0
0.0%
jan 1, 2002
103.112
+3.112
3.11%
jan 1, 2003
122.708
+19.597
19.01%
jan 1, 2004
140.821
+18.113
14.76%
jan 1, 2005
159.91
+19.089
13.56%
jan 1, 2006
131.425
-28.486
-17.81%
jan 1, 2007
168.528
+37.103
28.23%
jan 1, 2008
163.947
-4.581
-2.72%
jan 1, 2009
226.073
+62.126
37.89%
jan 1, 2010
118.378
-107.695
-47.64%
jan 1, 2011
124.012
+5.634
4.76%
jan 1, 2012
202.161
+78.149
63.02%
jan 1, 2013
185.957
-16.204
-8.02%
jan 1, 2014
193.437
+7.481
4.02%
jan 1, 2015
170.593
-22.844
-11.81%
jan 1, 2016
140.424
-30.169
-17.68%
Ranking of countries by current statistics by years