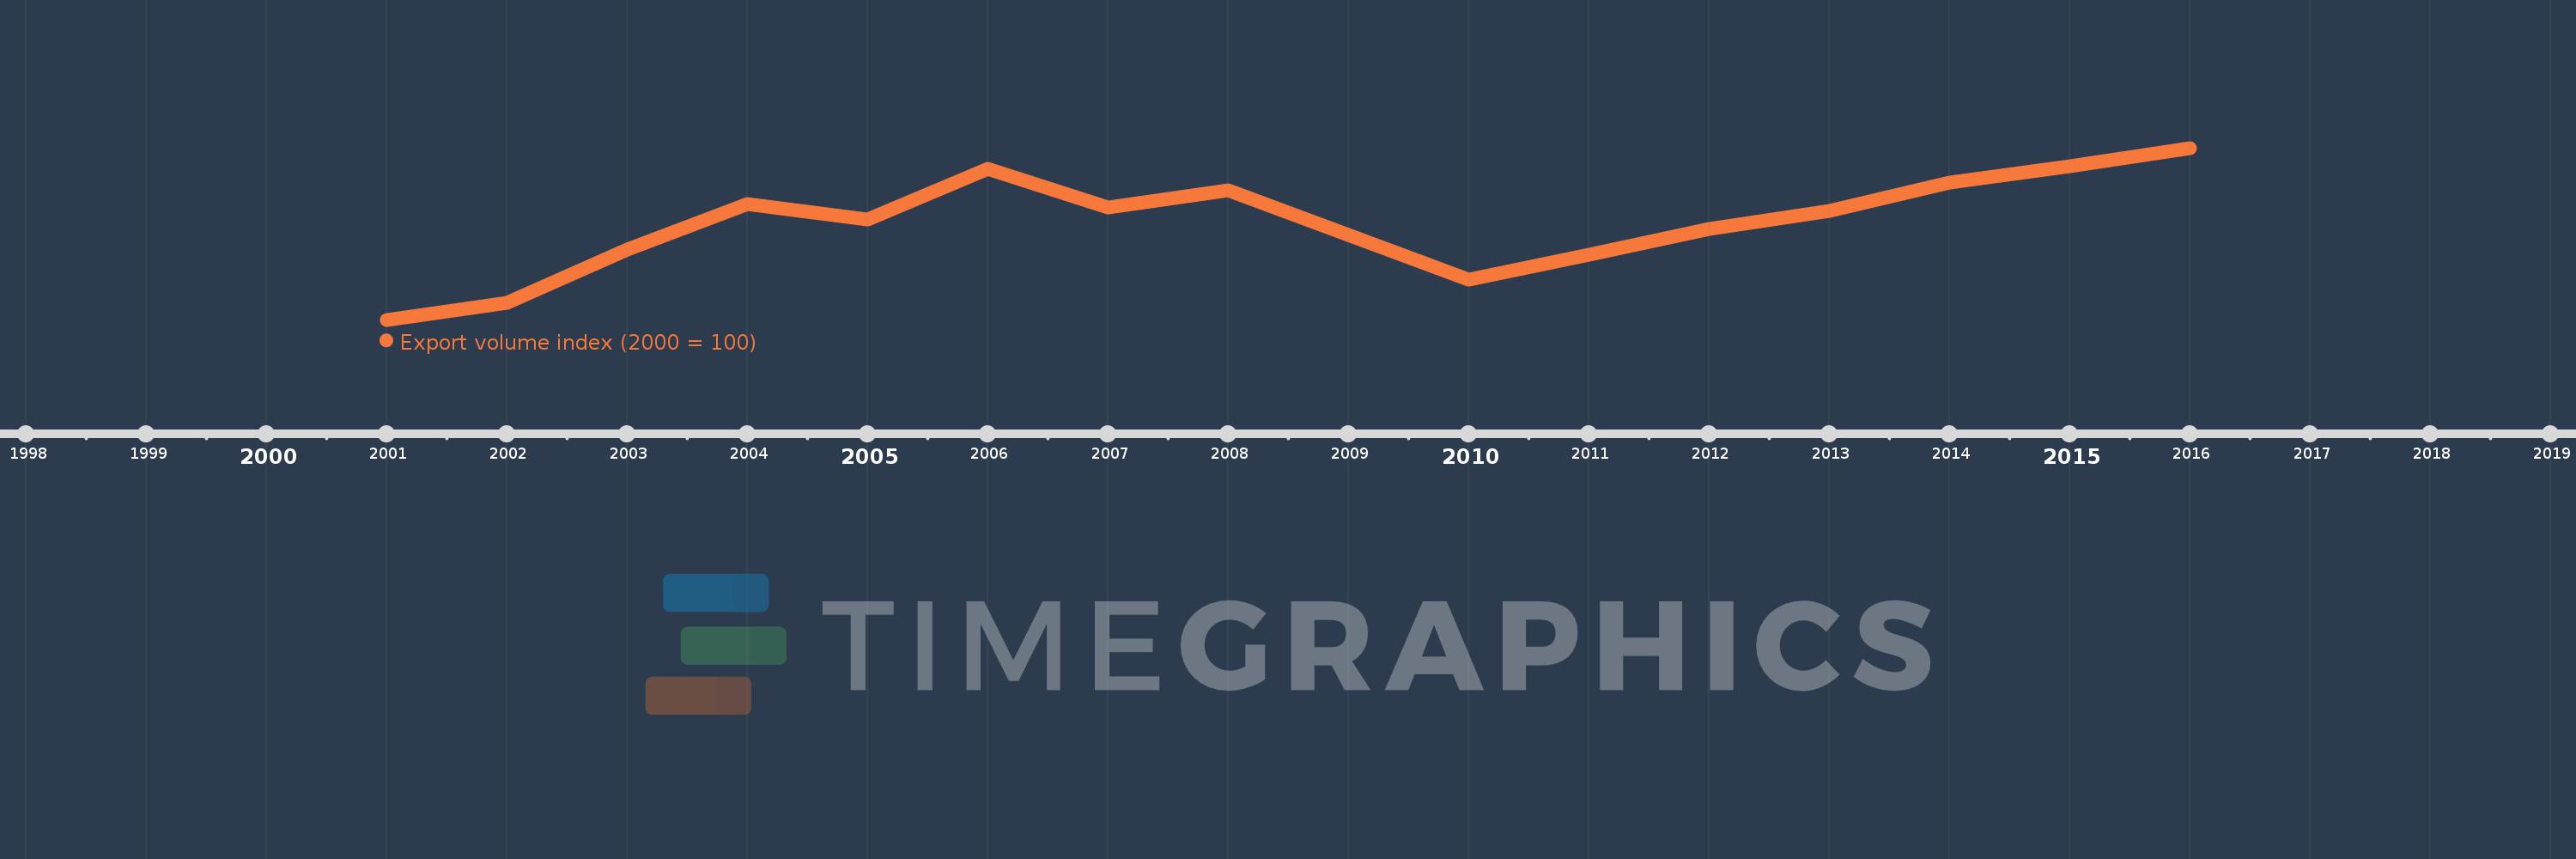
This timeline shows a graph from 2001 to 2016 of Armenia. No data until 2000. Number of actual observations by date: 16.
Source name:
World Development Indicators
Source organization:
United Nations Conference on Trade and Development, Handbook of Statistics and data files, and International Monetary Fund, International Financial Statistics.
Categories, topics:
Private Sector, Trade
Last updated:
apr 23, 2017
Indicators value changes by year
Meaning:
208.913
Minimum:
100.0
jan 1, 2001
Maximum:
293.281
jan 1, 2016
At the date of observation
Value
Absolute change
Change from the previous value
jan 1, 2001
100.0
+100.0
0.0%
jan 1, 2002
119.343
+19.343
19.34%
jan 1, 2003
179.103
+59.76
50.07%
jan 1, 2004
230.197
+51.094
28.53%
jan 1, 2005
212.4
-17.797
-7.73%
jan 1, 2006
269.82
+57.42
27.03%
jan 1, 2007
226.588
-43.232
-16.02%
jan 1, 2008
246.029
+19.441
8.58%
jan 1, 2009
195.468
-50.561
-20.55%
jan 1, 2010
145.014
-50.454
-25.81%
jan 1, 2011
172.826
+27.813
19.18%
jan 1, 2012
202.487
+29.661
17.16%
jan 1, 2013
222.72
+20.233
9.99%
jan 1, 2014
254.205
+31.485
14.14%
jan 1, 2015
273.129
+18.924
7.44%
jan 1, 2016
293.281
+20.152
7.38%
Ranking of countries by current statistics by years