33
/
AIzaSyAYiBZKx7MnpbEhh9jyipgxe19OcubqV5w
August 1, 2025
254062
Suriname
SUR
true
2
1
Export volume index (2000 = 100)
2016,2015,2014,2013,2012,2011,2010,2009,2008,2007,2006,2005,2004,2003,2002,2001,1989,1988,1987,1986,1985,1984,1983,1982,1981
Download
Global statistics library →Suriname →

Export volume index (2000 = 100)

This statistics in other country:

AfghanistanAlbaniaAlgeriaAmerican SamoaAndorraAngolaAntigua and BarbudaArgentinaArmeniaArubaAustraliaAustriaAzerbaijanBahamas, TheBahrainBangladeshBarbadosBelarusBelgiumBelizeBeninBermudaBhutanBoliviaBosnia and HerzegovinaBotswanaBrazilBritish Virgin IslandsBrunei DarussalamBulgariaBurkina FasoBurundiCabo VerdeCambodiaCameroonCanadaCayman IslandsCentral African RepublicChadChileChinaColombiaComorosCongo, Dem. Rep.Congo, Rep.Costa RicaCote d'IvoireCroatiaCubaCuracaoCyprusCzech RepublicDenmarkDjiboutiDominicaDominican RepublicEcuadorEgypt, Arab Rep.El SalvadorEquatorial GuineaEritreaEstoniaEthiopiaFaroe IslandsFijiFinlandFranceFrench PolynesiaGabonGambia, TheGeorgiaGermanyGhanaGibraltarGreeceGreenlandGrenadaGuamGuatemalaGuineaGuinea-BissauGuyanaHaitiHondurasHong Kong SAR, ChinaHungaryIcelandIndiaIndonesiaIran, Islamic Rep.IraqIrelandIsraelItalyJamaicaJapanJordanKazakhstanKenyaKiribatiKorea, Dem. People’s Rep.Korea, Rep.KuwaitKyrgyz RepublicLao PDRLatviaLebanonLesothoLiberiaLibyaLithuaniaLuxembourgMacao SAR, ChinaMacedonia, FYRMadagascarMalawiMalaysiaMaldivesMaliMaltaMarshall IslandsMauritaniaMauritiusMexicoMicronesia, Fed. Sts.MoldovaMongoliaMoroccoMozambiqueMyanmarNamibiaNauruNepalNetherlandsNew CaledoniaNew ZealandNicaraguaNigerNigeriaNorthern Mariana IslandsNorwayOmanPakistanPalauPanamaPapua New GuineaParaguayPeruPhilippinesPolandPortugalQatarRomaniaRussian FederationRwandaSamoaSao Tome and PrincipeSaudi ArabiaSenegalSerbiaSeychellesSierra LeoneSingaporeSlovak RepublicSloveniaSolomon IslandsSomaliaSouth AfricaSpainSri LankaSt. Kitts and NevisSt. LuciaSt. Vincent and the GrenadinesSudanSurinameSwazilandSwedenSwitzerlandSyrian Arab RepublicTajikistanTanzaniaThailandTogoTongaTrinidad and TobagoTunisiaTurkeyTurkmenistanTurks and Caicos IslandsUgandaUkraineUnited Arab EmiratesUnited KingdomUnited StatesUruguayUzbekistanVanuatuVenezuela, RBVietnamWest Bank and GazaYemen, Rep.ZambiaZimbabwe

Timeline:

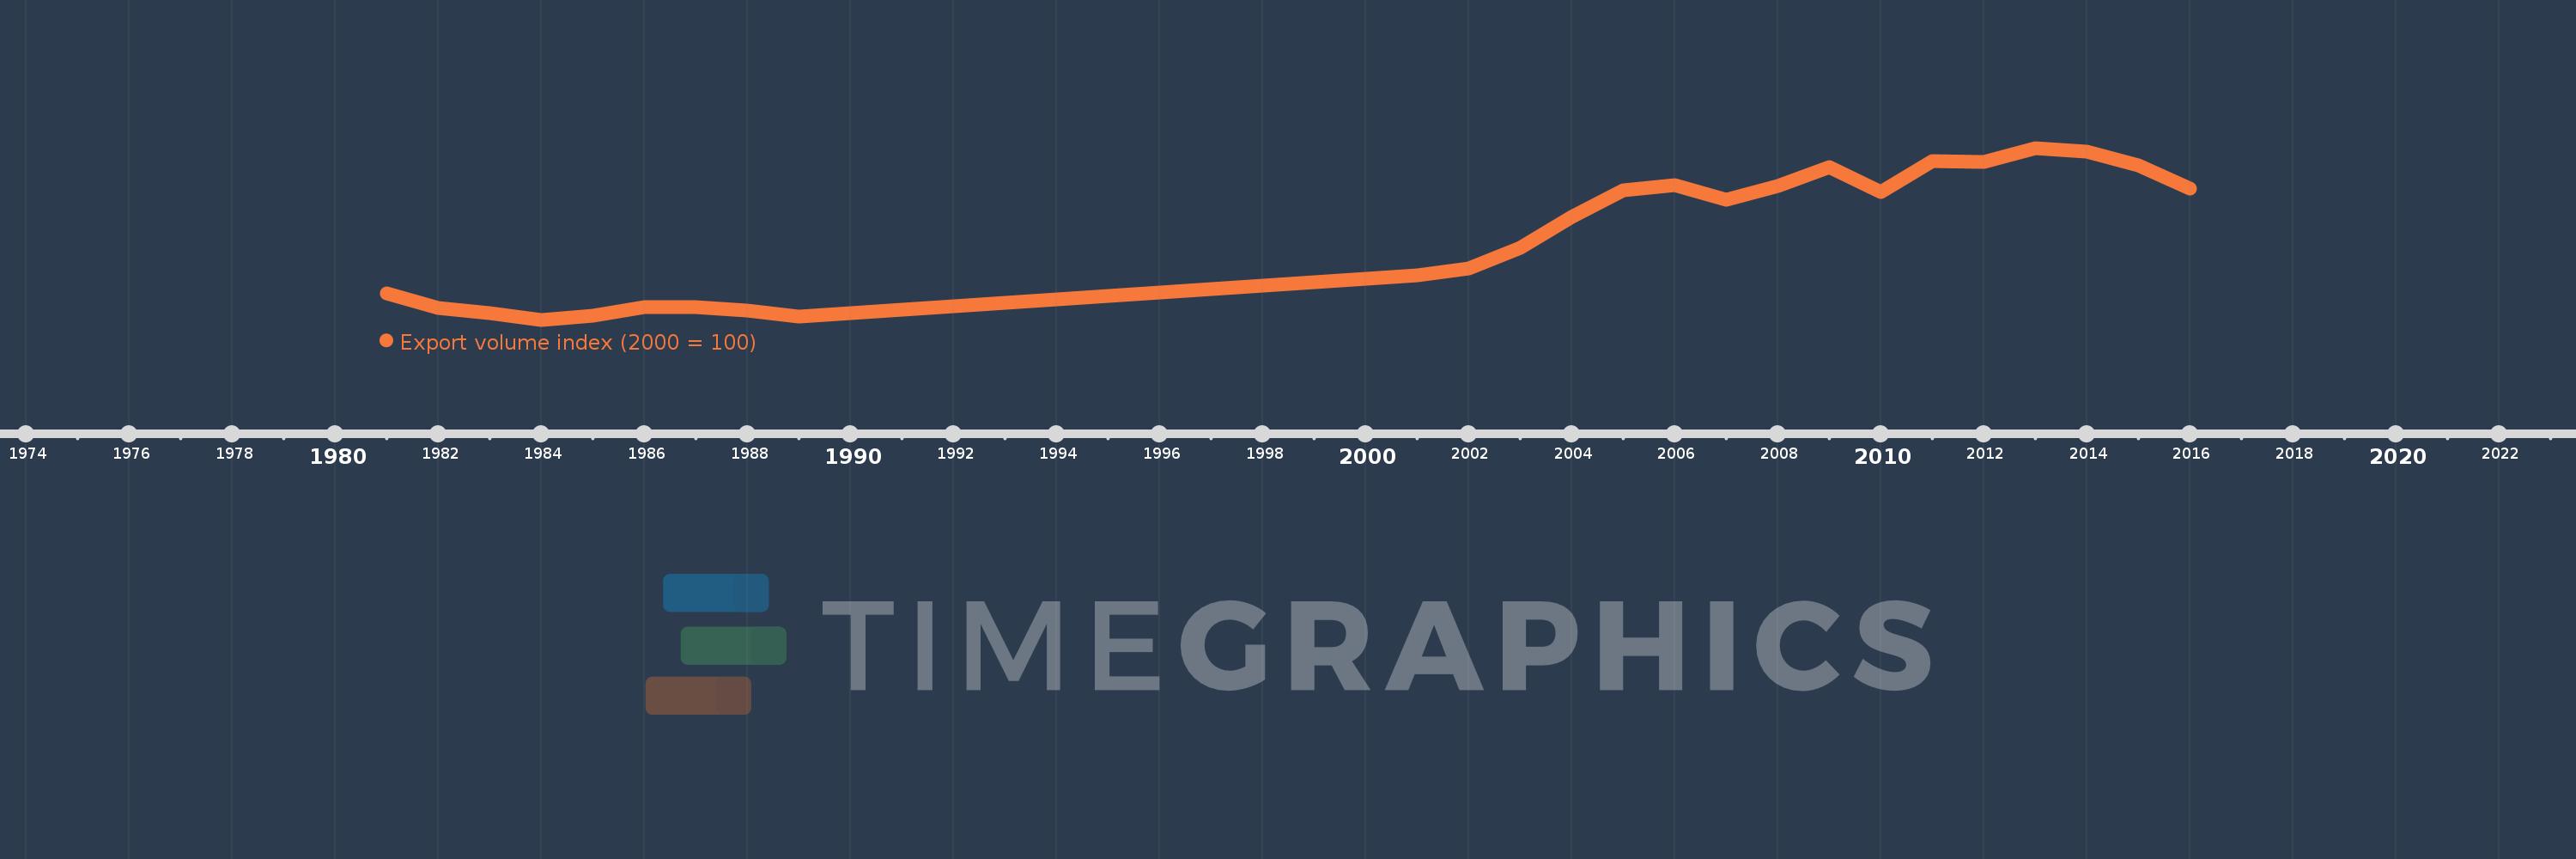
This timeline shows a graph from 1981 to 2016 of Suriname. No data until 1980. Number of actual observations by date: 25.

Source name:

World Development Indicators

Source organization:

United Nations Conference on Trade and Development, Handbook of Statistics and data files, and International Monetary Fund, International Financial Statistics.

Categories, topics:

Private Sector, Trade

Last updated:

apr 23, 2017

Indicators value changes by year

Meaning:
143.01
Minimum:
51.746
jan 1, 1984
Maximum:
238.655
jan 1, 2013
At the date of observation
Value
Absolute change
Change from the previous value
jan 1, 1981
80.14
+80.14
0.0%
jan 1, 1982
64.309
-15.83
-19.75%
jan 1, 1983
59.311
-4.999
-7.77%
jan 1, 1984
51.746
-7.565
-12.75%
jan 1, 1985
56.0
+4.254
8.22%
jan 1, 1986
65.085
+9.085
16.22%
jan 1, 1987
65.707
+0.622
0.96%
jan 1, 1988
62.072
-3.635
-5.53%
jan 1, 1989
55.37
-6.702
-10.8%
jan 1, 2001
100.0
+44.63
80.6%
jan 1, 2002
107.55
+7.55
7.55%
jan 1, 2003
129.645
+22.095
20.54%
jan 1, 2004
163.776
+34.131
26.33%
jan 1, 2005
192.755
+28.979
17.69%
jan 1, 2006
198.422
+5.667
2.94%
jan 1, 2007
181.987
-16.435
-8.28%
jan 1, 2008
196.964
+14.977
8.23%
jan 1, 2009
218.163
+21.2
10.76%
jan 1, 2010
190.809
-27.354
-12.54%
jan 1, 2011
224.139
+33.33
17.47%
jan 1, 2012
223.346
-0.794
-0.35%
jan 1, 2013
238.655
+15.309
6.85%
jan 1, 2014
234.679
-3.976
-1.67%
jan 1, 2015
220.137
-14.542
-6.2%
jan 1, 2016
194.494
-25.643
-11.65%

Ranking of countries by current statistics by years