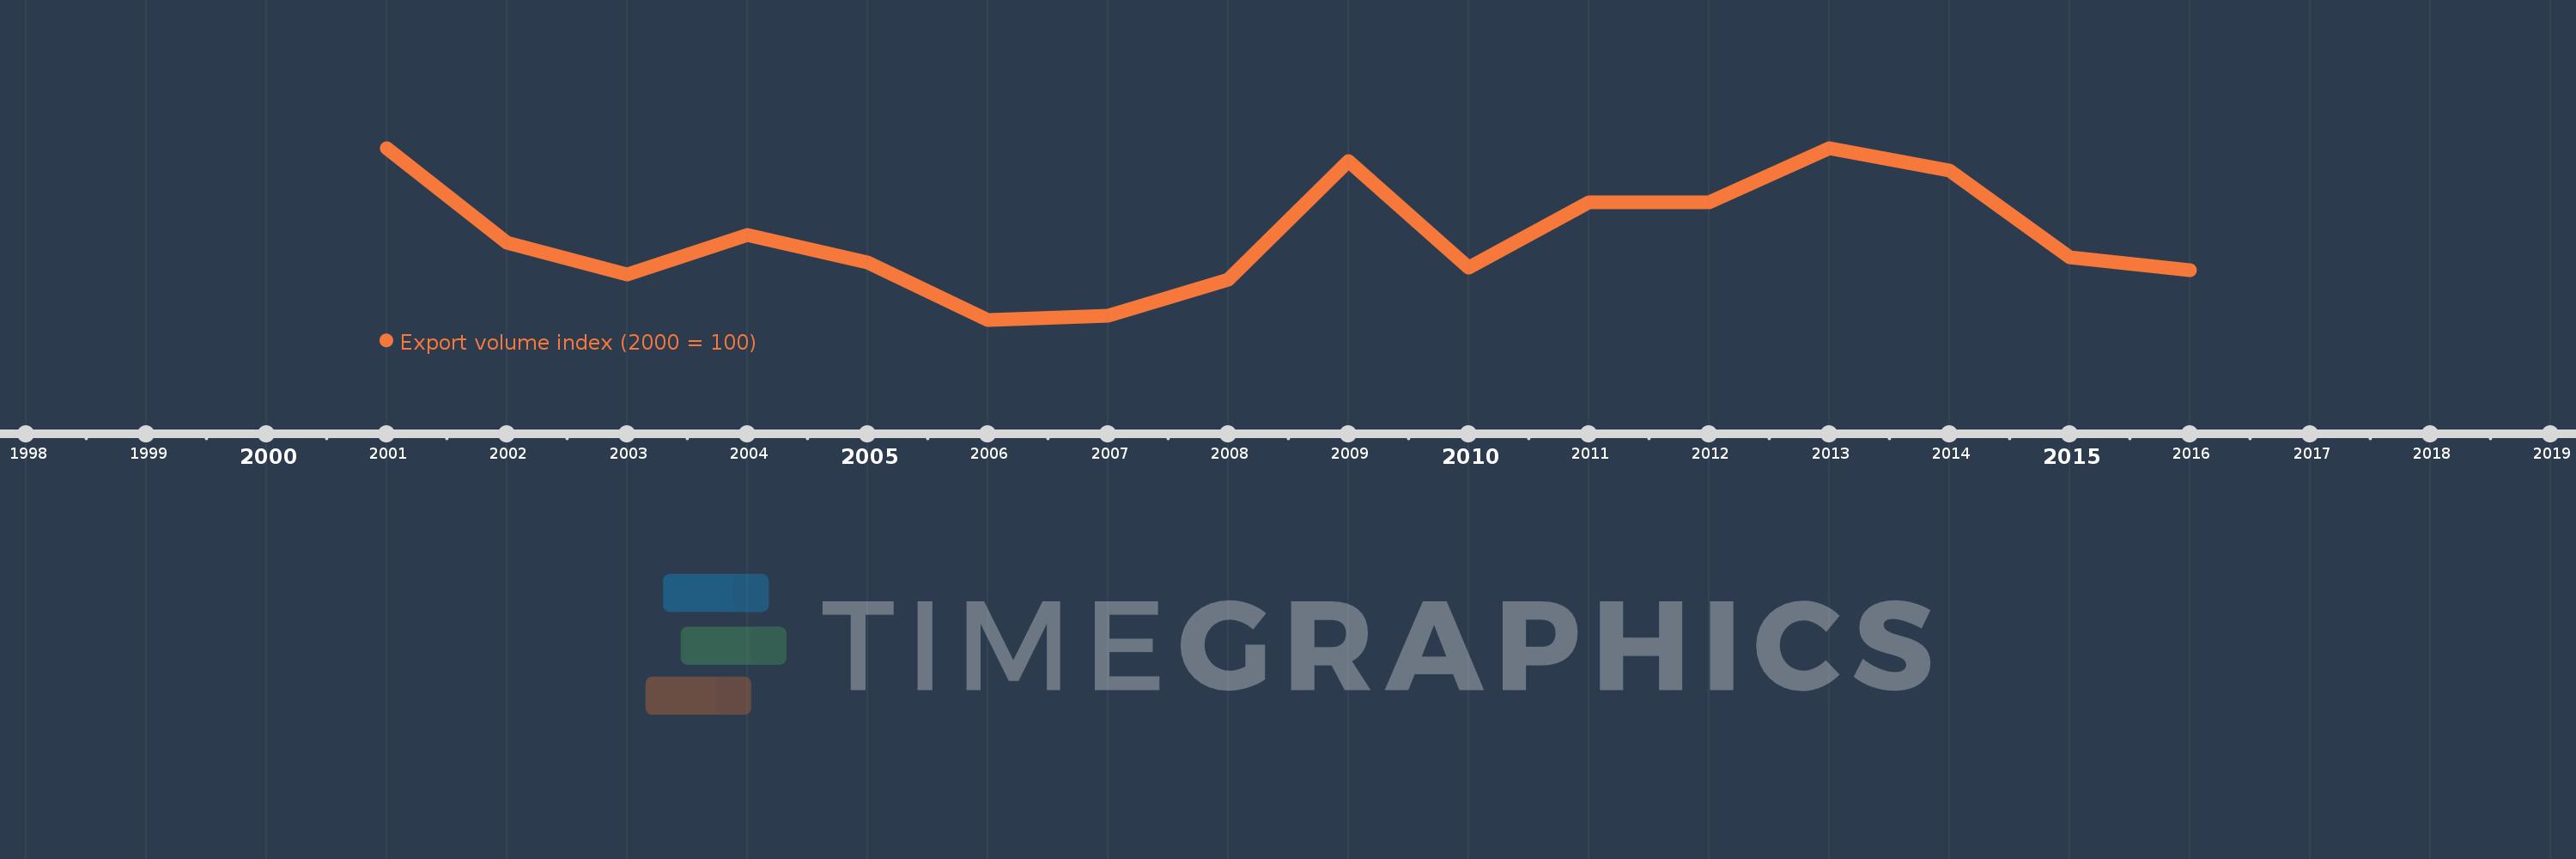
This timeline shows a graph from 2001 to 2016 of Nauru. No data until 2000. Number of actual observations by date: 16.
Source name:
World Development Indicators
Source organization:
United Nations Conference on Trade and Development, Handbook of Statistics and data files, and International Monetary Fund, International Financial Statistics.
Categories, topics:
Private Sector, Trade
Last updated:
apr 23, 2017
Indicators value changes by year
Meaning:
54.008
Minimum:
8.807
jan 1, 2006
Maximum:
100.349
jan 1, 2013
At the date of observation
Value
Absolute change
Change from the previous value
jan 1, 2001
100.0
+100.0
0.0%
jan 1, 2002
49.923
-50.077
-50.08%
jan 1, 2003
32.715
-17.208
-34.47%
jan 1, 2004
53.826
+21.11
64.53%
jan 1, 2005
39.499
-14.326
-26.62%
jan 1, 2006
8.807
-30.692
-77.7%
jan 1, 2007
11.068
+2.261
25.67%
jan 1, 2008
30.162
+19.095
172.53%
jan 1, 2009
93.329
+63.167
209.42%
jan 1, 2010
36.571
-56.758
-60.82%
jan 1, 2011
71.15
+34.579
94.55%
jan 1, 2012
71.354
+0.204
0.29%
jan 1, 2013
100.349
+28.996
40.64%
jan 1, 2014
88.131
-12.219
-12.18%
jan 1, 2015
41.874
-46.257
-52.49%
jan 1, 2016
35.374
-6.5
-15.52%
Ranking of countries by current statistics by years