33
/
AIzaSyAYiBZKx7MnpbEhh9jyipgxe19OcubqV5w
August 1, 2025
244547
Somalia
SOM
true
2
1
Export volume index (2000 = 100)
2016,2015,2014,2013,2012,2011,2010,2009,2008,2007,2006,2005,2004,2003,2002,2001
Download
Global statistics library →Somalia →

Export volume index (2000 = 100)

This statistics in other country:

AfghanistanAlbaniaAlgeriaAmerican SamoaAndorraAngolaAntigua and BarbudaArgentinaArmeniaArubaAustraliaAustriaAzerbaijanBahamas, TheBahrainBangladeshBarbadosBelarusBelgiumBelizeBeninBermudaBhutanBoliviaBosnia and HerzegovinaBotswanaBrazilBritish Virgin IslandsBrunei DarussalamBulgariaBurkina FasoBurundiCabo VerdeCambodiaCameroonCanadaCayman IslandsCentral African RepublicChadChileChinaColombiaComorosCongo, Dem. Rep.Congo, Rep.Costa RicaCote d'IvoireCroatiaCubaCuracaoCyprusCzech RepublicDenmarkDjiboutiDominicaDominican RepublicEcuadorEgypt, Arab Rep.El SalvadorEquatorial GuineaEritreaEstoniaEthiopiaFaroe IslandsFijiFinlandFranceFrench PolynesiaGabonGambia, TheGeorgiaGermanyGhanaGibraltarGreeceGreenlandGrenadaGuamGuatemalaGuineaGuinea-BissauGuyanaHaitiHondurasHong Kong SAR, ChinaHungaryIcelandIndiaIndonesiaIran, Islamic Rep.IraqIrelandIsraelItalyJamaicaJapanJordanKazakhstanKenyaKiribatiKorea, Dem. People’s Rep.Korea, Rep.KuwaitKyrgyz RepublicLao PDRLatviaLebanonLesothoLiberiaLibyaLithuaniaLuxembourgMacao SAR, ChinaMacedonia, FYRMadagascarMalawiMalaysiaMaldivesMaliMaltaMarshall IslandsMauritaniaMauritiusMexicoMicronesia, Fed. Sts.MoldovaMongoliaMoroccoMozambiqueMyanmarNamibiaNauruNepalNetherlandsNew CaledoniaNew ZealandNicaraguaNigerNigeriaNorthern Mariana IslandsNorwayOmanPakistanPalauPanamaPapua New GuineaParaguayPeruPhilippinesPolandPortugalQatarRomaniaRussian FederationRwandaSamoaSao Tome and PrincipeSaudi ArabiaSenegalSerbiaSeychellesSierra LeoneSingaporeSlovak RepublicSloveniaSolomon IslandsSomaliaSouth AfricaSpainSri LankaSt. Kitts and NevisSt. LuciaSt. Vincent and the GrenadinesSudanSurinameSwazilandSwedenSwitzerlandSyrian Arab RepublicTajikistanTanzaniaThailandTogoTongaTrinidad and TobagoTunisiaTurkeyTurkmenistanTurks and Caicos IslandsUgandaUkraineUnited Arab EmiratesUnited KingdomUnited StatesUruguayUzbekistanVanuatuVenezuela, RBVietnamWest Bank and GazaYemen, Rep.ZambiaZimbabwe

Timeline:

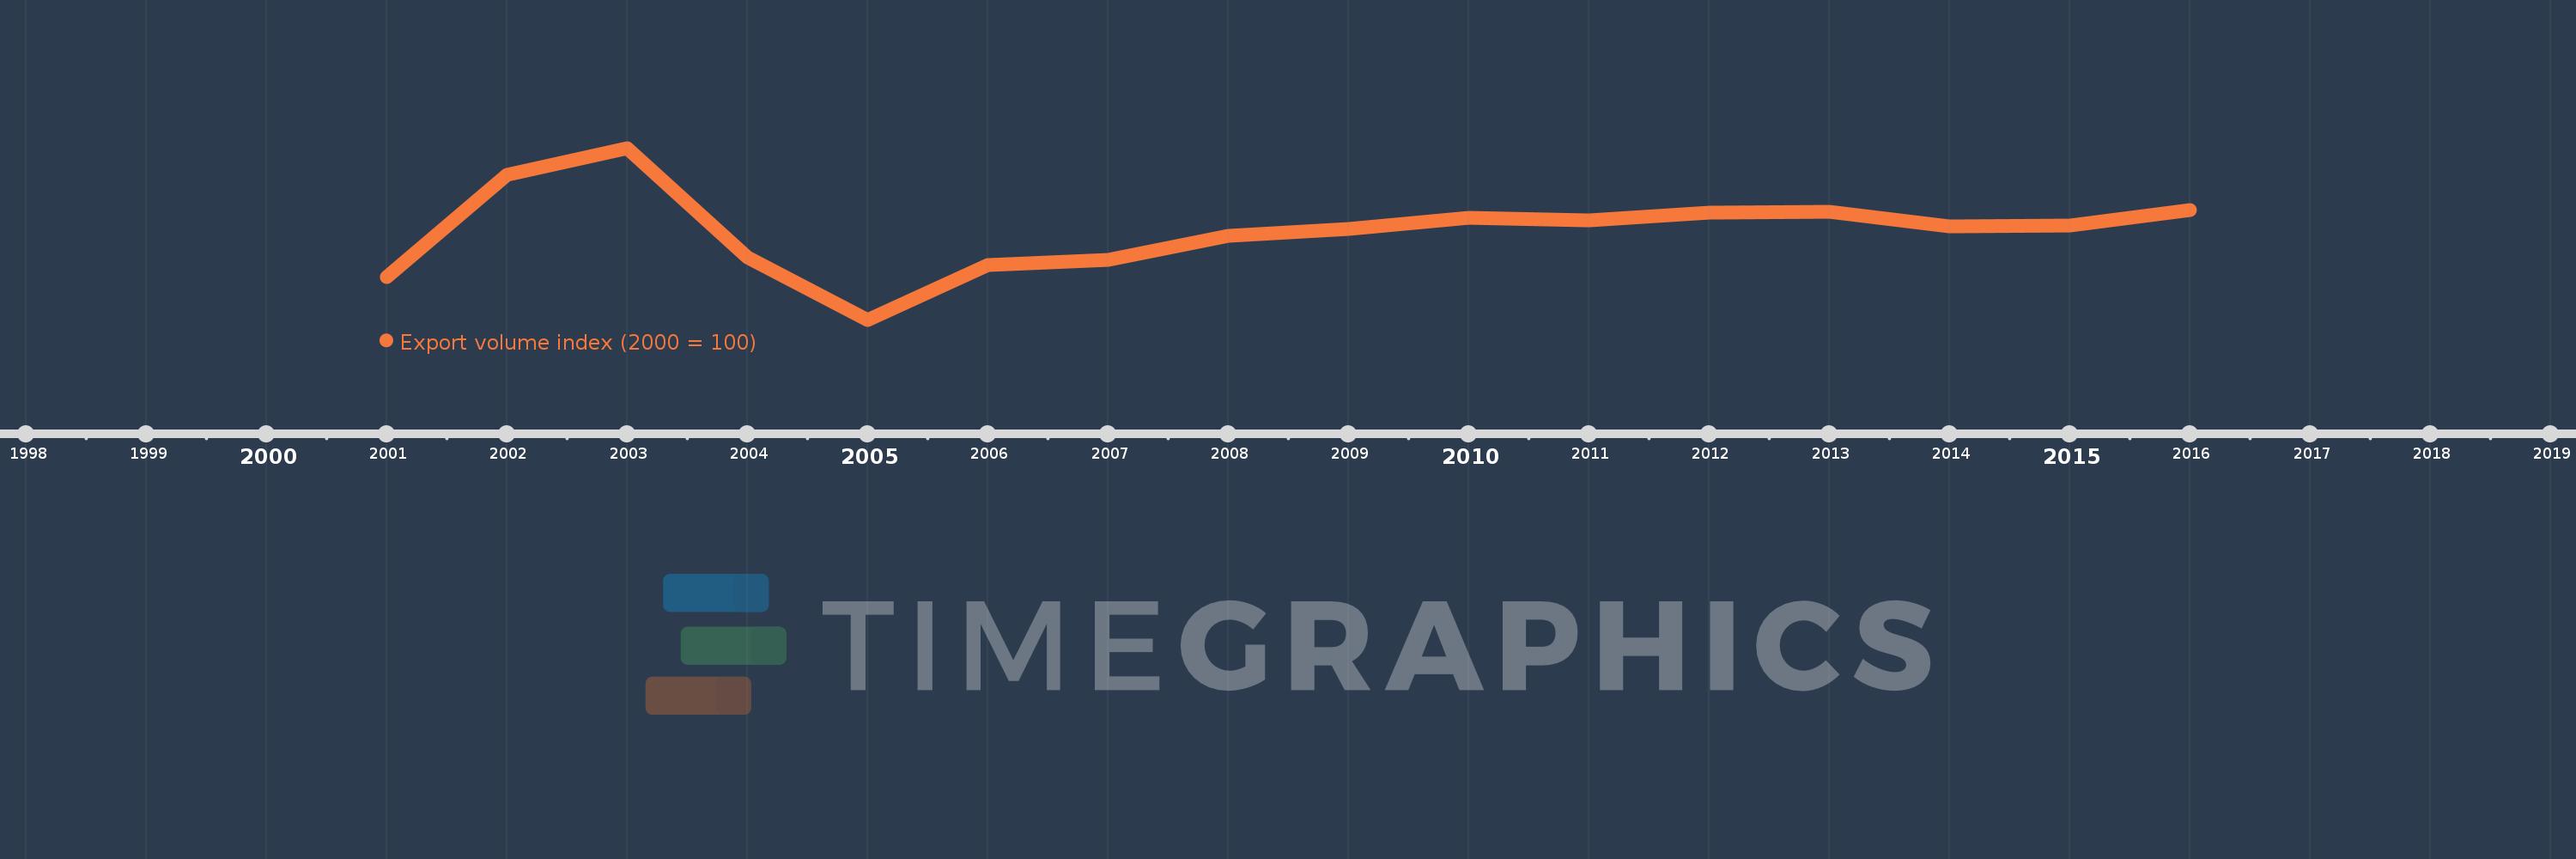
This timeline shows a graph from 2001 to 2016 of Somalia. No data until 2000. Number of actual observations by date: 16.

Source name:

World Development Indicators

Source organization:

United Nations Conference on Trade and Development, Handbook of Statistics and data files, and International Monetary Fund, International Financial Statistics.

Categories, topics:

Private Sector, Trade

Last updated:

apr 23, 2017

Indicators value changes by year

Meaning:
121.963
Minimum:
79.922
jan 1, 2005
Maximum:
161.019
jan 1, 2003
At the date of observation
Value
Absolute change
Change from the previous value
jan 1, 2001
100.0
+100.0
0.0%
jan 1, 2002
148.403
+48.403
48.4%
jan 1, 2003
161.019
+12.617
8.5%
jan 1, 2004
109.331
-51.688
-32.1%
jan 1, 2005
79.922
-29.409
-26.9%
jan 1, 2006
105.599
+25.677
32.13%
jan 1, 2007
108.306
+2.707
2.56%
jan 1, 2008
119.615
+11.309
10.44%
jan 1, 2009
122.977
+3.362
2.81%
jan 1, 2010
128.052
+5.075
4.13%
jan 1, 2011
126.705
-1.347
-1.05%
jan 1, 2012
130.401
+3.696
2.92%
jan 1, 2013
130.983
+0.582
0.45%
jan 1, 2014
123.925
-7.058
-5.39%
jan 1, 2015
124.444
+0.519
0.42%
jan 1, 2016
131.727
+7.283
5.85%

Ranking of countries by current statistics by years