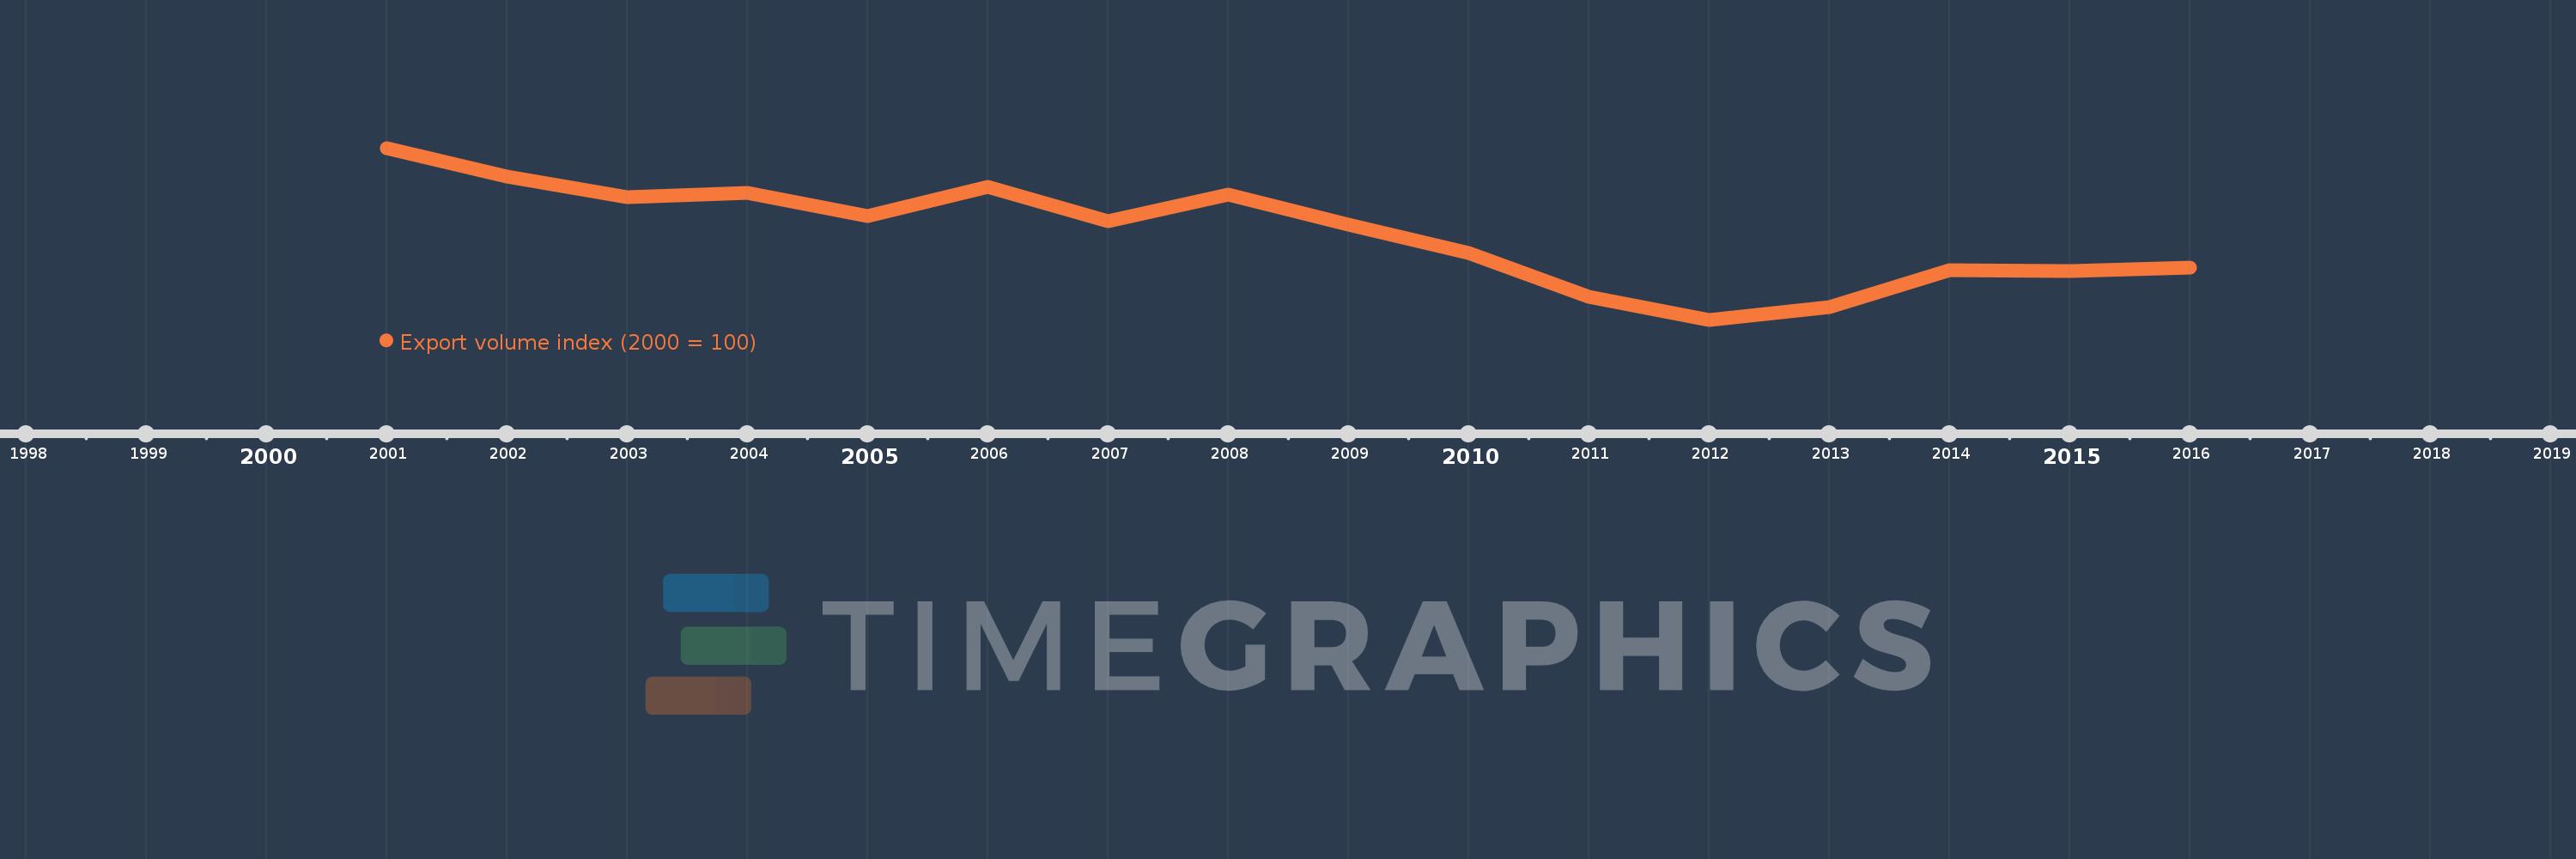
This timeline shows a graph from 2001 to 2016 of St. Vincent and the Grenadines. No data until 2000. Number of actual observations by date: 16.
Source name:
World Development Indicators
Source organization:
United Nations Conference on Trade and Development, Handbook of Statistics and data files, and International Monetary Fund, International Financial Statistics.
Categories, topics:
Private Sector, Trade
Last updated:
apr 23, 2017
Indicators value changes by year
Meaning:
70.951
Minimum:
42.012
jan 1, 2012
Maximum:
100.0
jan 1, 2001
At the date of observation
Value
Absolute change
Change from the previous value
jan 1, 2001
100.0
+100.0
0.0%
jan 1, 2002
90.414
-9.586
-9.59%
jan 1, 2003
83.344
-7.07
-7.82%
jan 1, 2004
84.817
+1.472
1.77%
jan 1, 2005
76.991
-7.825
-9.23%
jan 1, 2006
86.965
+9.973
12.95%
jan 1, 2007
75.181
-11.783
-13.55%
jan 1, 2008
84.303
+9.122
12.13%
jan 1, 2009
73.981
-10.322
-12.24%
jan 1, 2010
64.424
-9.557
-12.92%
jan 1, 2011
49.819
-14.605
-22.67%
jan 1, 2012
42.012
-7.807
-15.67%
jan 1, 2013
46.408
+4.396
10.46%
jan 1, 2014
58.68
+12.272
26.44%
jan 1, 2015
58.401
-0.279
-0.48%
jan 1, 2016
59.473
+1.072
1.83%
Ranking of countries by current statistics by years