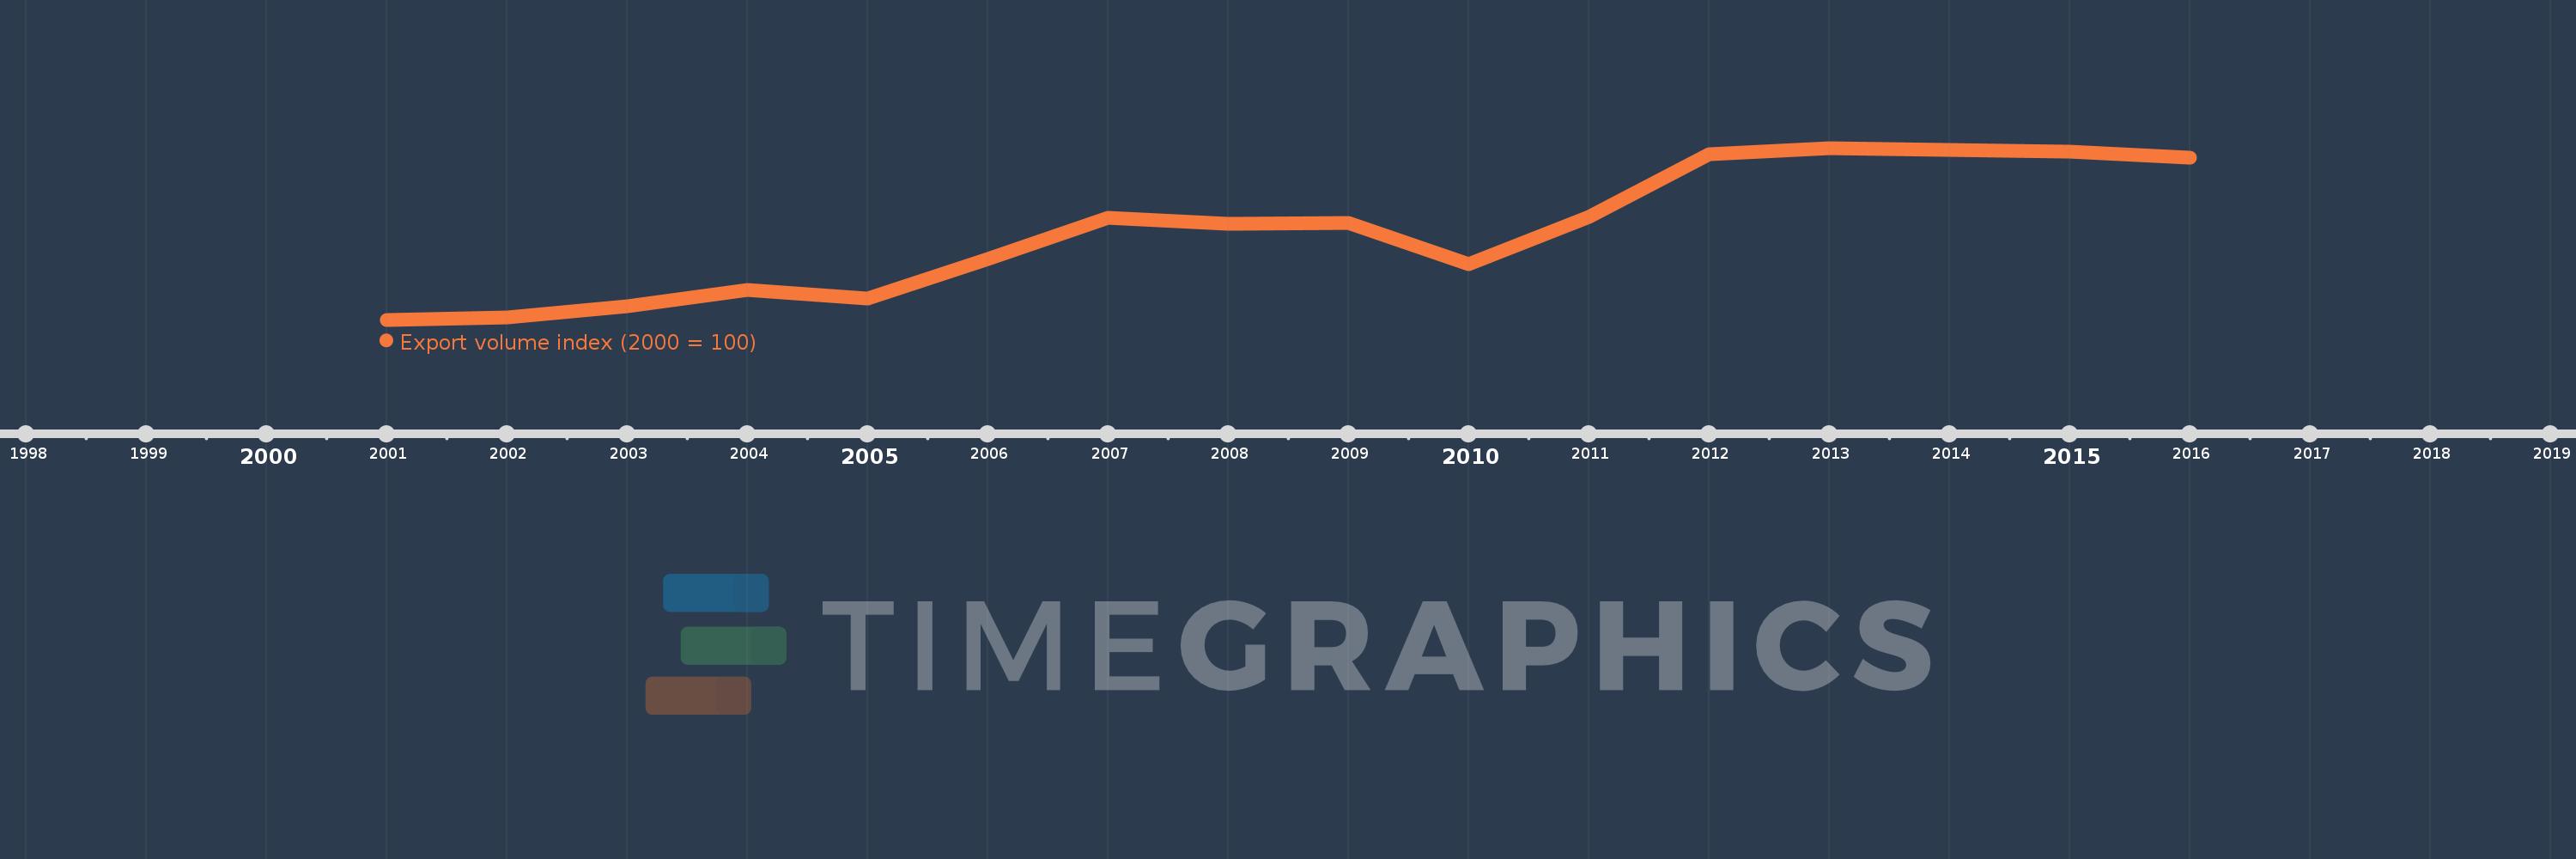
This timeline shows a graph from 2001 to 2016 of Estonia. No data until 2000. Number of actual observations by date: 16.
Source name:
World Development Indicators
Source organization:
United Nations Conference on Trade and Development, Handbook of Statistics and data files, and International Monetary Fund, International Financial Statistics.
Categories, topics:
Private Sector, Trade
Last updated:
apr 23, 2017
Indicators value changes by year
Meaning:
164.034
Minimum:
100.0
jan 1, 2001
Maximum:
224.072
jan 1, 2013
At the date of observation
Value
Absolute change
Change from the previous value
jan 1, 2001
100.0
+100.0
0.0%
jan 1, 2002
101.562
+1.562
1.56%
jan 1, 2003
110.039
+8.478
8.35%
jan 1, 2004
121.747
+11.708
10.64%
jan 1, 2005
115.08
-6.668
-5.48%
jan 1, 2006
144.041
+28.962
25.17%
jan 1, 2007
173.695
+29.654
20.59%
jan 1, 2008
169.026
-4.669
-2.69%
jan 1, 2009
169.916
+0.89
0.53%
jan 1, 2010
140.256
-29.659
-17.46%
jan 1, 2011
174.323
+34.066
24.29%
jan 1, 2012
219.853
+45.53
26.12%
jan 1, 2013
224.072
+4.219
1.92%
jan 1, 2014
222.599
-1.473
-0.66%
jan 1, 2015
221.509
-1.09
-0.49%
jan 1, 2016
216.829
-4.68
-2.11%
Ranking of countries by current statistics by years