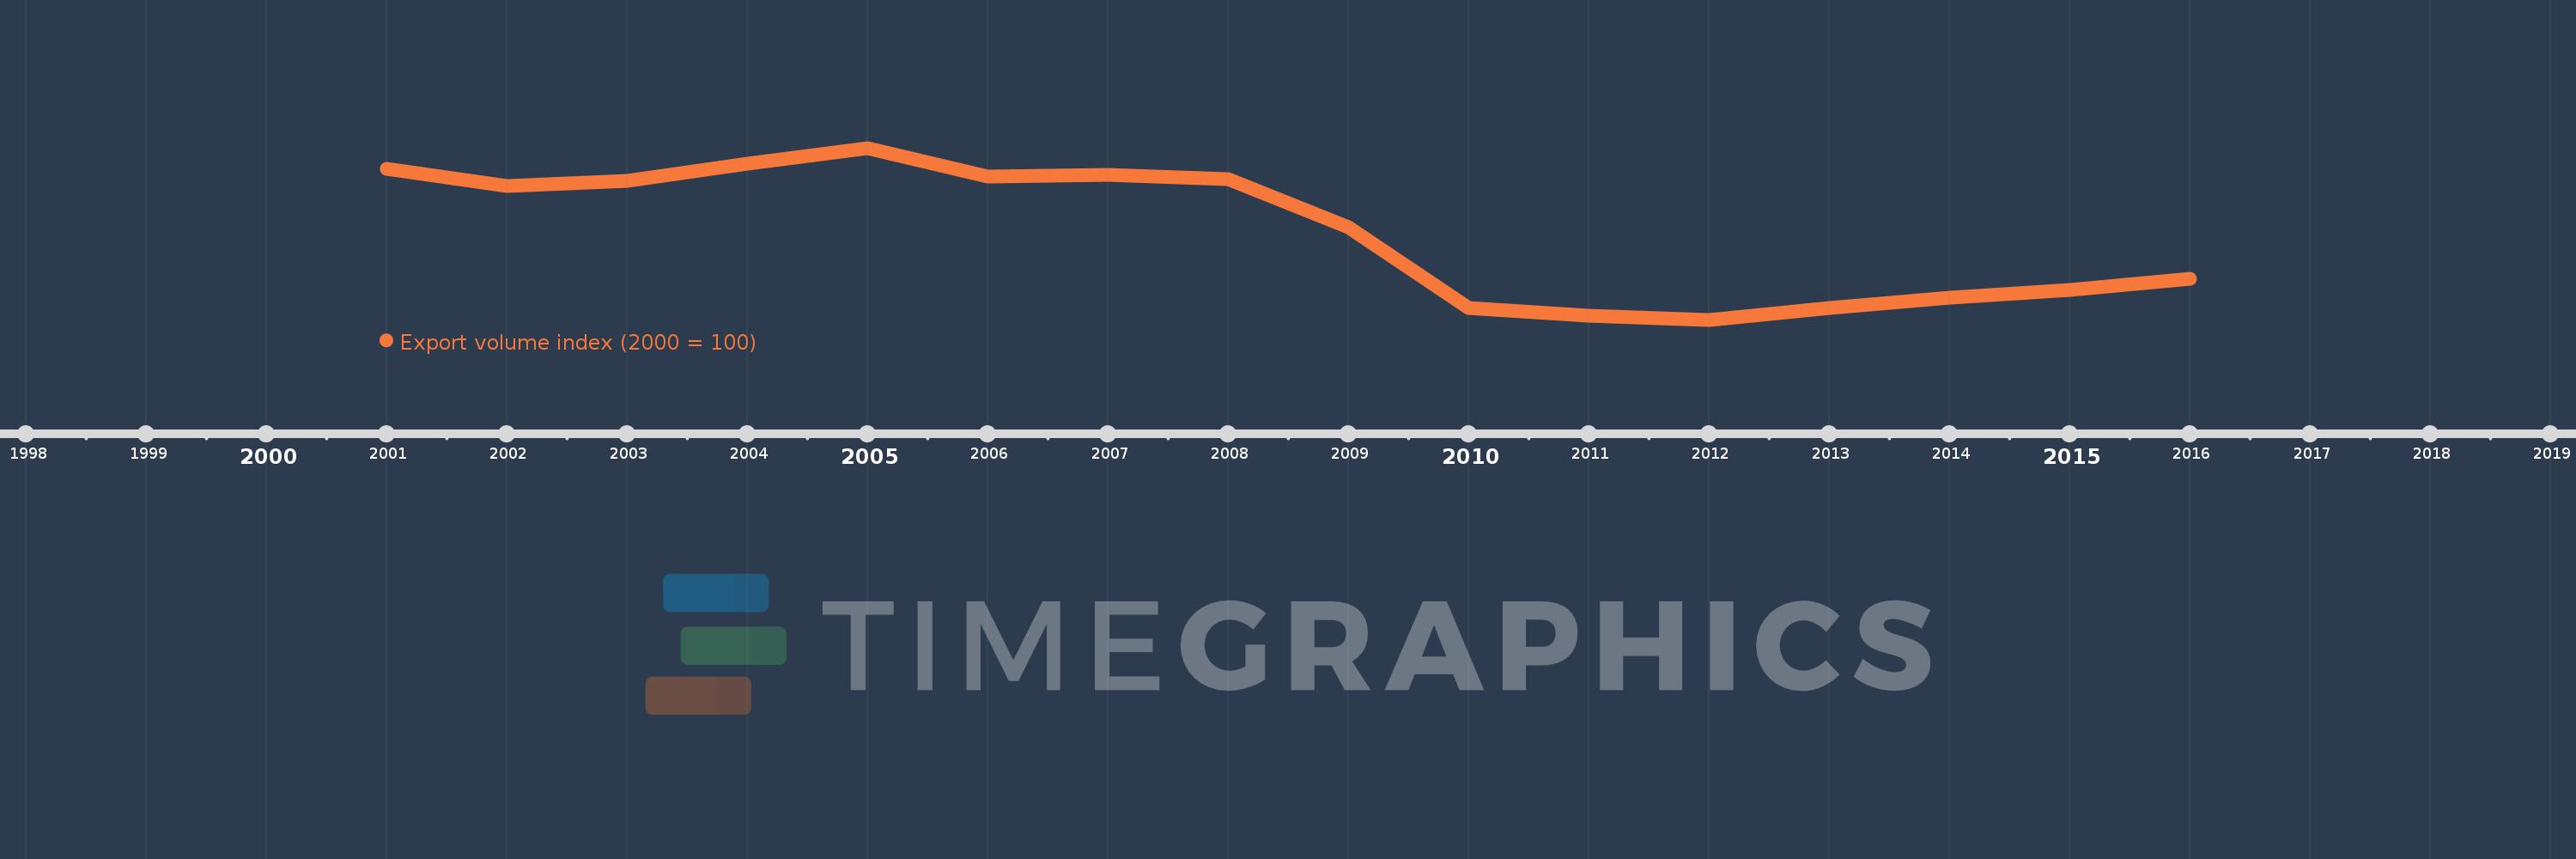
This timeline shows a graph from 2001 to 2016 of Macao SAR, China. No data until 2000. Number of actual observations by date: 16.
Source name:
World Development Indicators
Source organization:
United Nations Conference on Trade and Development, Handbook of Statistics and data files, and International Monetary Fund, International Financial Statistics.
Categories, topics:
Private Sector, Trade
Last updated:
apr 23, 2017
Indicators value changes by year
Meaning:
69.639
Minimum:
28.099
jan 1, 2012
Maximum:
110.141
jan 1, 2005
At the date of observation
Value
Absolute change
Change from the previous value
jan 1, 2001
100.0
+100.0
0.0%
jan 1, 2002
91.864
-8.136
-8.14%
jan 1, 2003
94.351
+2.487
2.71%
jan 1, 2004
102.703
+8.352
8.85%
jan 1, 2005
110.141
+7.438
7.24%
jan 1, 2006
96.329
-13.812
-12.54%
jan 1, 2007
97.405
+1.076
1.12%
jan 1, 2008
95.167
-2.238
-2.3%
jan 1, 2009
72.319
-22.848
-24.01%
jan 1, 2010
33.664
-38.656
-53.45%
jan 1, 2011
30.103
-3.561
-10.58%
jan 1, 2012
28.099
-2.005
-6.66%
jan 1, 2013
33.62
+5.522
19.65%
jan 1, 2014
38.459
+4.839
14.39%
jan 1, 2015
42.249
+3.789
9.85%
jan 1, 2016
47.743
+5.494
13.0%
Ranking of countries by current statistics by years