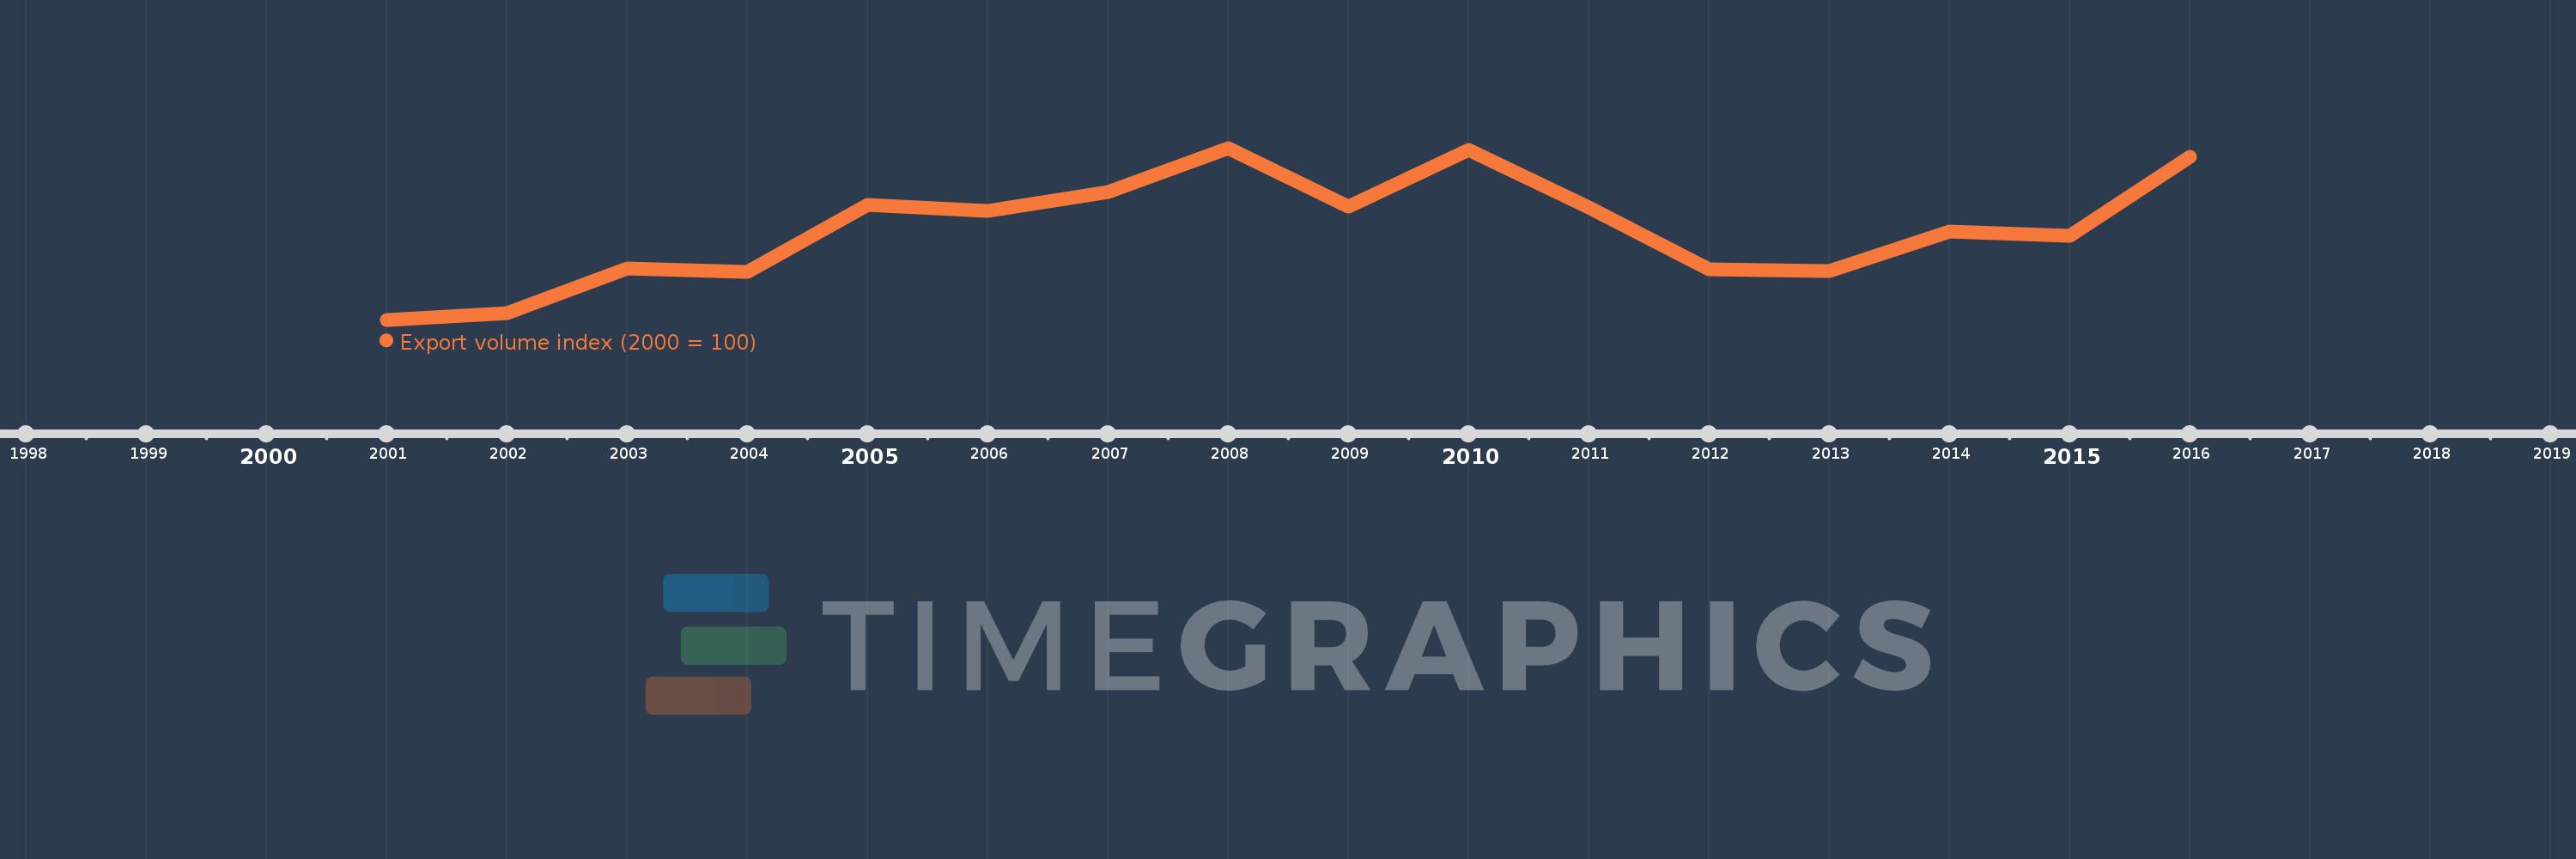
This timeline shows a graph from 2001 to 2016 of Gibraltar. No data until 2000. Number of actual observations by date: 16.
Source name:
World Development Indicators
Source organization:
United Nations Conference on Trade and Development, Handbook of Statistics and data files, and International Monetary Fund, International Financial Statistics.
Categories, topics:
Private Sector, Trade
Last updated:
apr 23, 2017
Indicators value changes by year
Meaning:
153.442
Minimum:
100.0
jan 1, 2001
Maximum:
200.747
jan 1, 2008
At the date of observation
Value
Absolute change
Change from the previous value
jan 1, 2001
100.0
+100.0
0.0%
jan 1, 2002
103.955
+3.955
3.96%
jan 1, 2003
130.181
+26.226
25.23%
jan 1, 2004
128.001
-2.18
-1.67%
jan 1, 2005
167.141
+39.139
30.58%
jan 1, 2006
163.643
-3.498
-2.09%
jan 1, 2007
175.088
+11.445
6.99%
jan 1, 2008
200.747
+25.66
14.66%
jan 1, 2009
166.498
-34.249
-17.06%
jan 1, 2010
199.616
+33.118
19.89%
jan 1, 2011
165.833
-33.783
-16.92%
jan 1, 2012
129.407
-36.427
-21.97%
jan 1, 2013
128.36
-1.047
-0.81%
jan 1, 2014
151.531
+23.171
18.05%
jan 1, 2015
149.399
-2.132
-1.41%
jan 1, 2016
195.678
+46.279
30.98%
Ranking of countries by current statistics by years