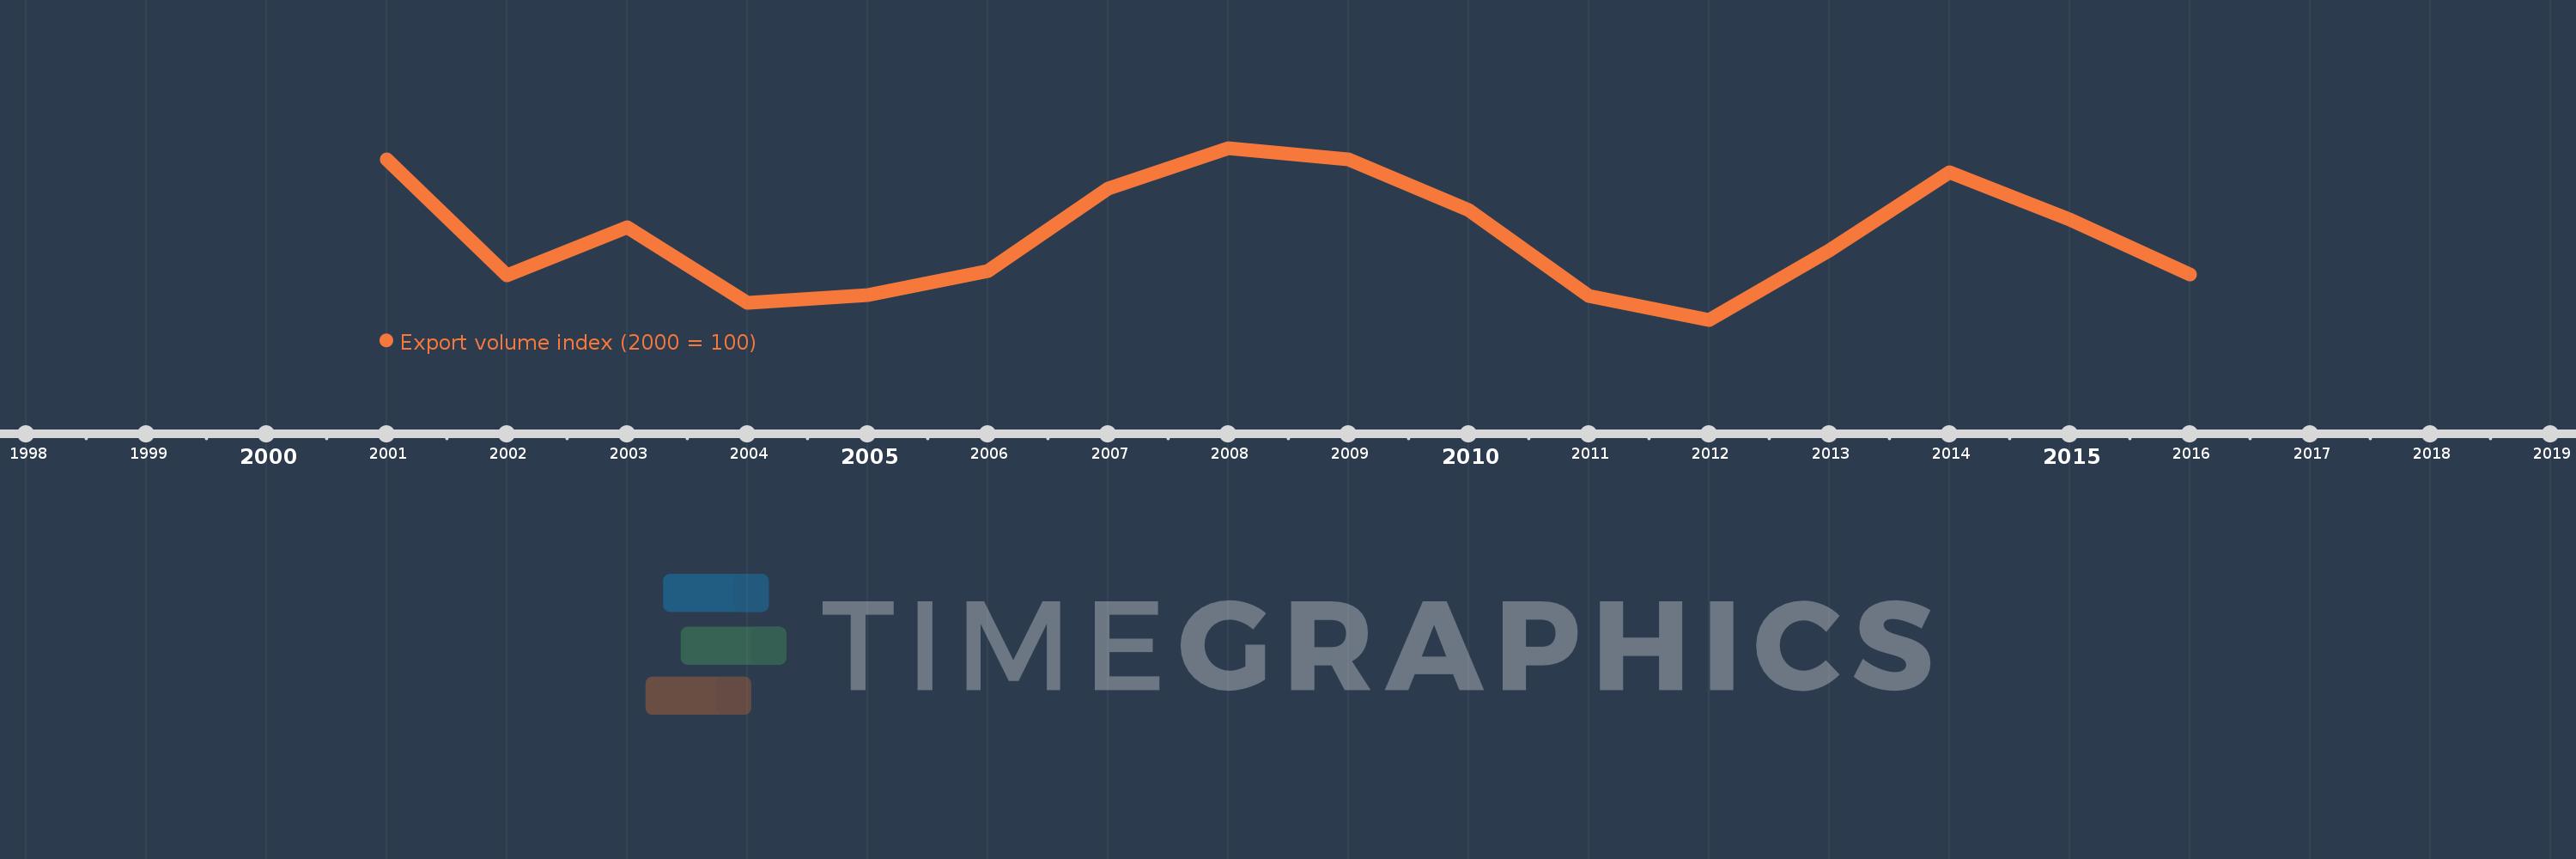
This timeline shows a graph from 2001 to 2016 of Bahamas, The. No data until 2000. Number of actual observations by date: 16.
Source name:
World Development Indicators
Source organization:
United Nations Conference on Trade and Development, Handbook of Statistics and data files, and International Monetary Fund, International Financial Statistics.
Categories, topics:
Private Sector, Trade
Last updated:
apr 23, 2017
Indicators value changes by year
Meaning:
87.429
Minimum:
73.575
jan 1, 2012
Maximum:
101.853
jan 1, 2008
At the date of observation
Value
Absolute change
Change from the previous value
jan 1, 2001
100.0
+100.0
0.0%
jan 1, 2002
80.873
-19.127
-19.13%
jan 1, 2003
88.815
+7.943
9.82%
jan 1, 2004
76.39
-12.425
-13.99%
jan 1, 2005
77.59
+1.2
1.57%
jan 1, 2006
81.606
+4.016
5.18%
jan 1, 2007
95.12
+13.514
16.56%
jan 1, 2008
101.853
+6.733
7.08%
jan 1, 2009
99.965
-1.888
-1.85%
jan 1, 2010
91.591
-8.373
-8.38%
jan 1, 2011
77.453
-14.138
-15.44%
jan 1, 2012
73.575
-3.878
-5.01%
jan 1, 2013
84.972
+11.398
15.49%
jan 1, 2014
97.914
+12.942
15.23%
jan 1, 2015
90.079
-7.835
-8.0%
jan 1, 2016
81.069
-9.009
-10.0%
Ranking of countries by current statistics by years